Overlay figures for easy comparison


Instructions

This tool is designed to help visually correlate multiple types of data by laying transparent figures atop one another. To use it, follow these steps:

  • From the main page(s), drag-and-drop figures onto the button with this icon:
  • Expand this dialog box and use the Overlay button (to the right) to render a new figure by overlaying the ones selected
  • Add more figures using the steps above, click Overlay to re-render, and use the Download button to save to a local file
  • Use the Clear button to clear all figure selections

Note: figures are remembered across tabs, so multiple times and subsystems can be compared at once.

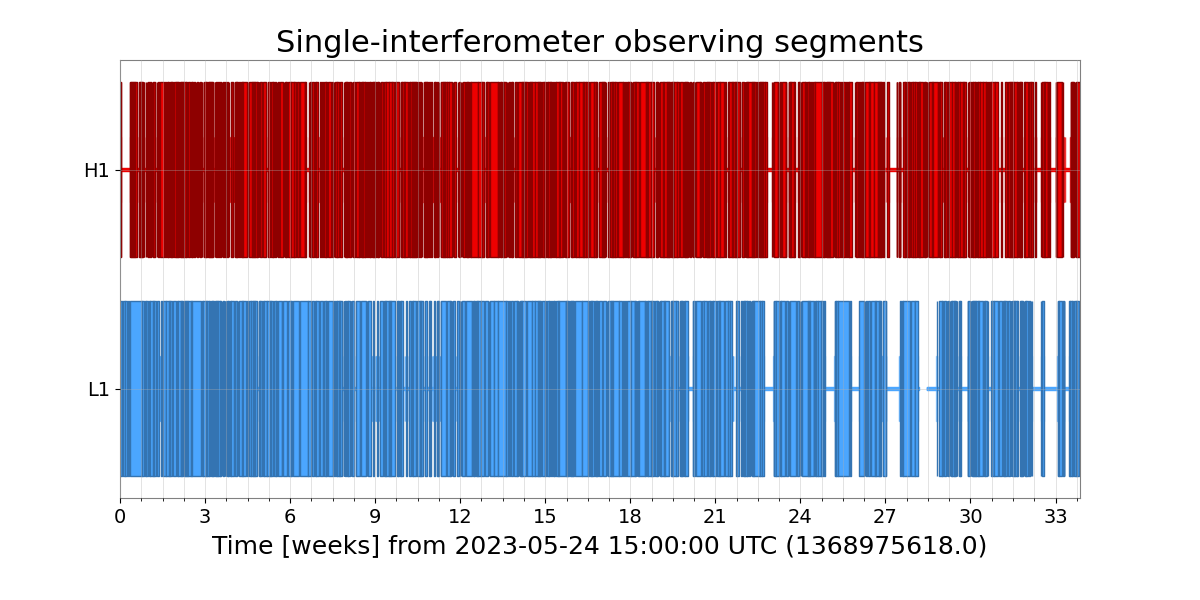
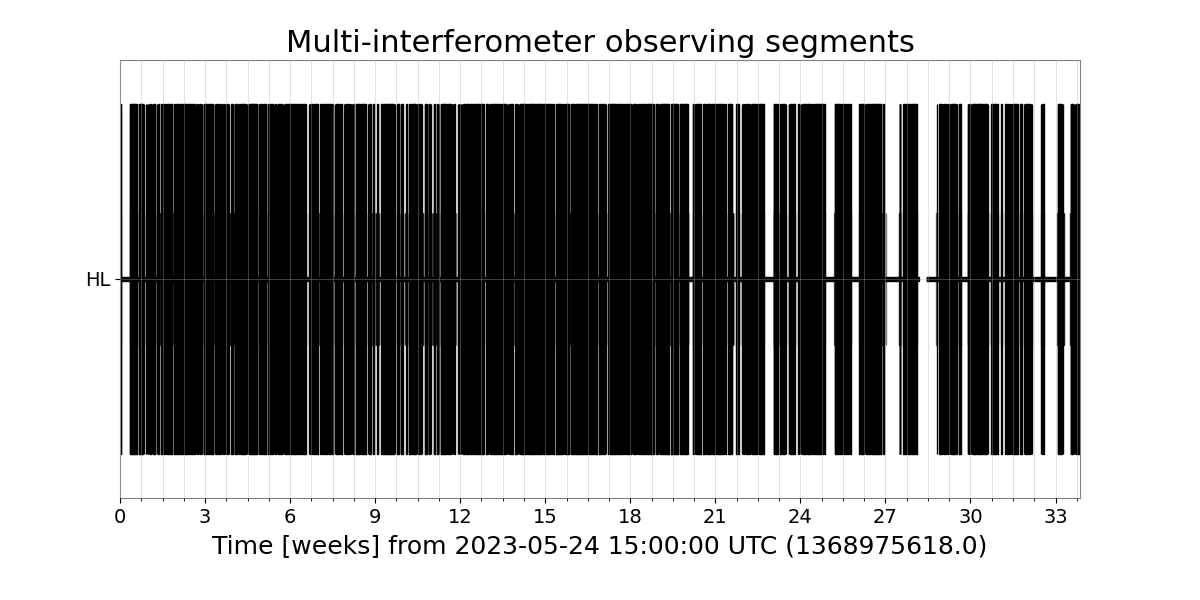
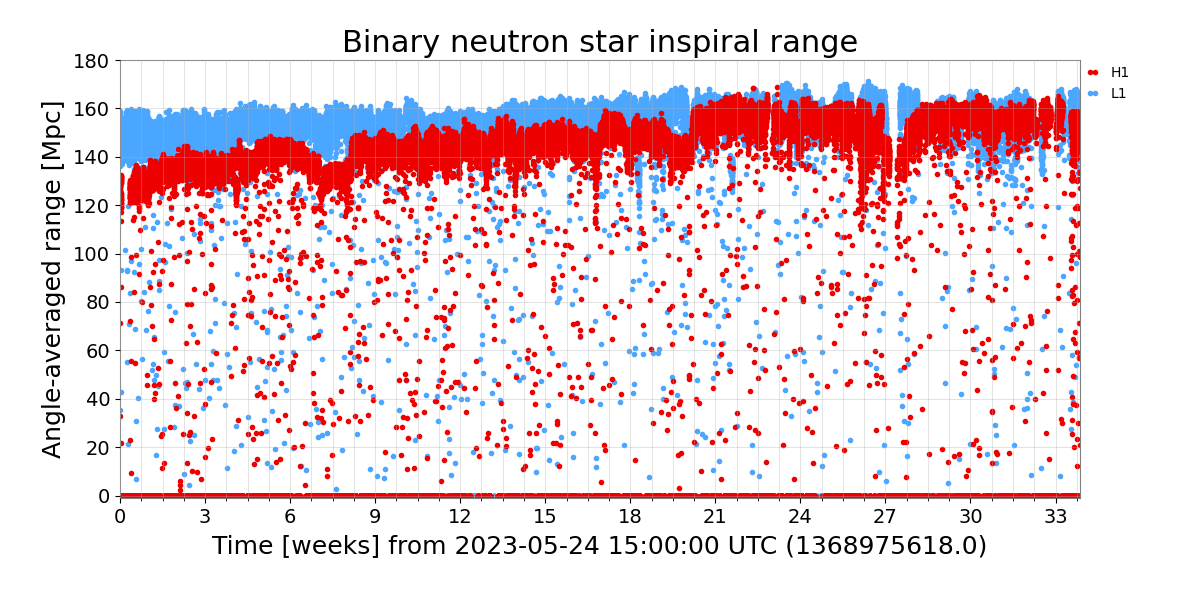
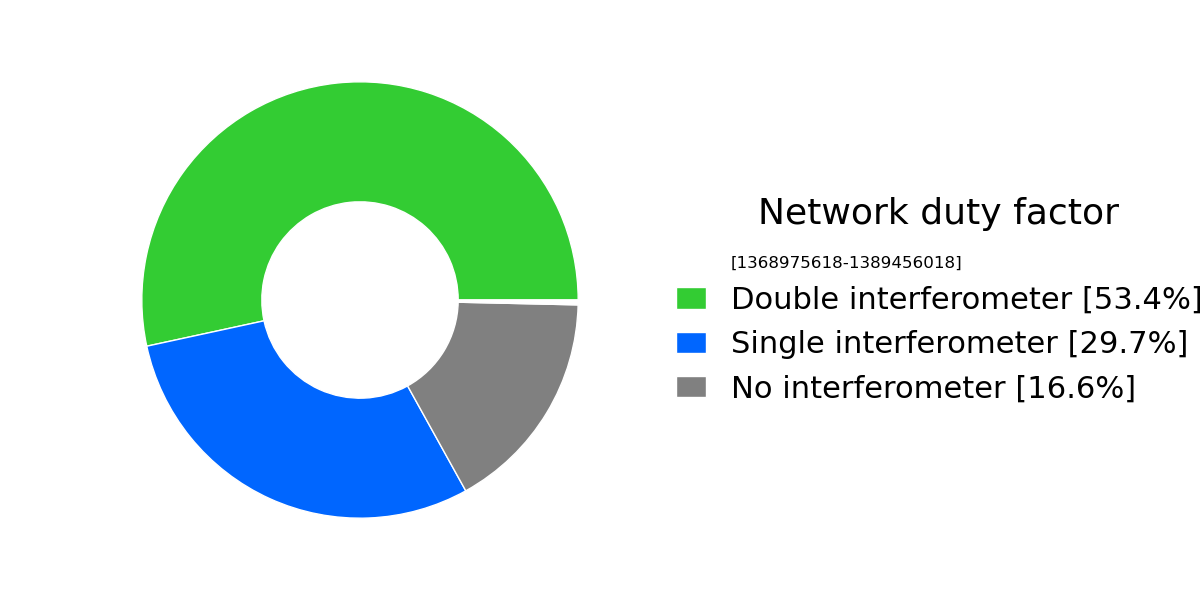
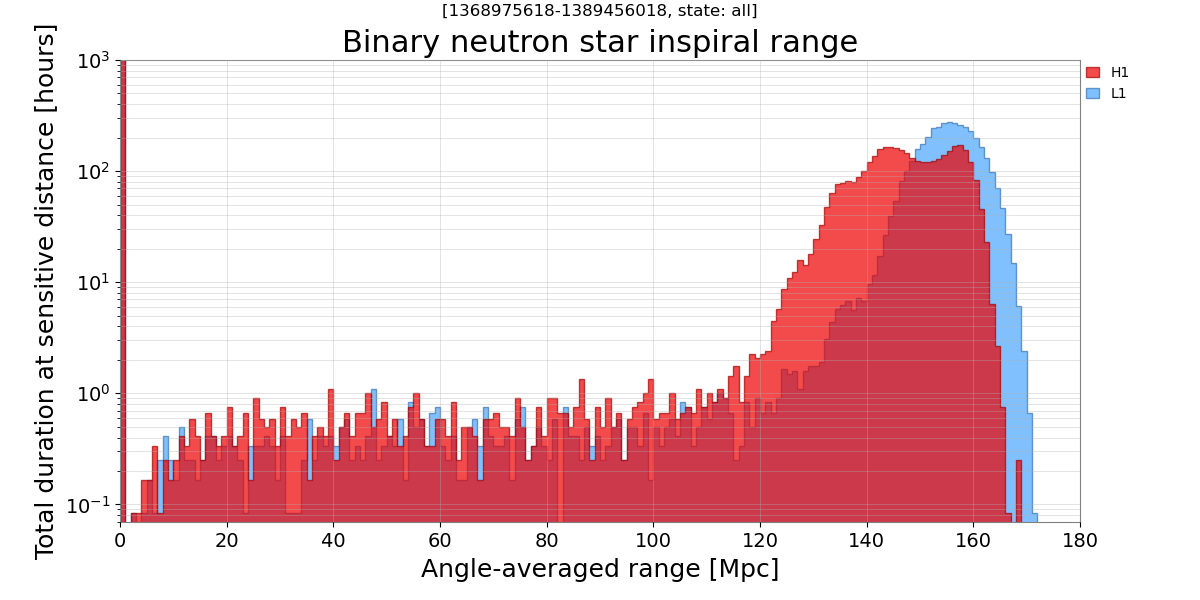
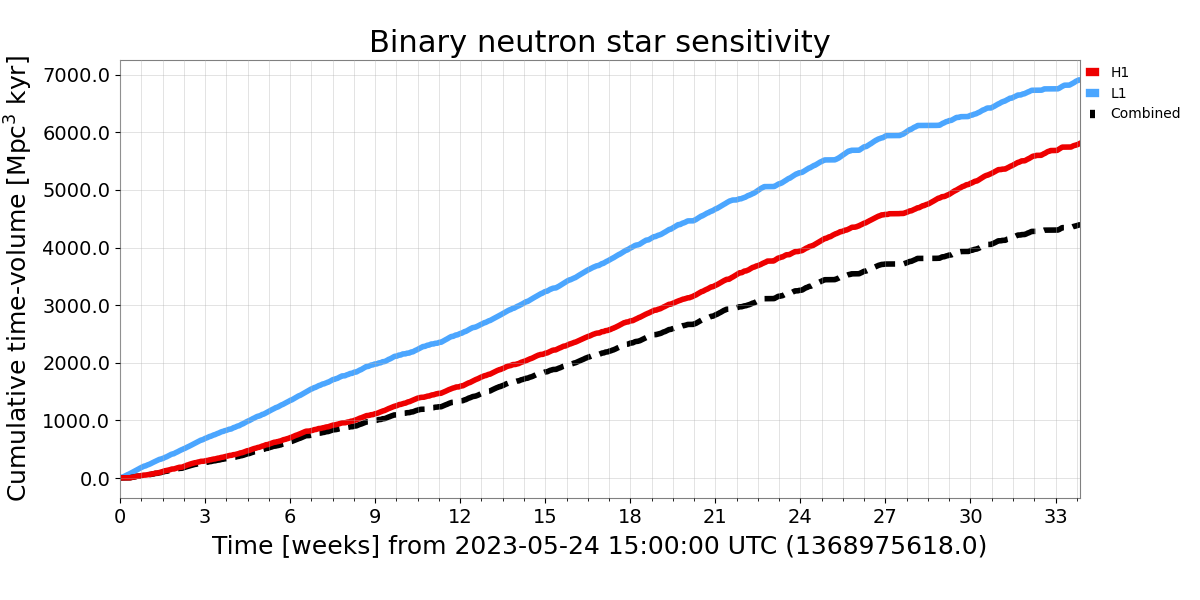
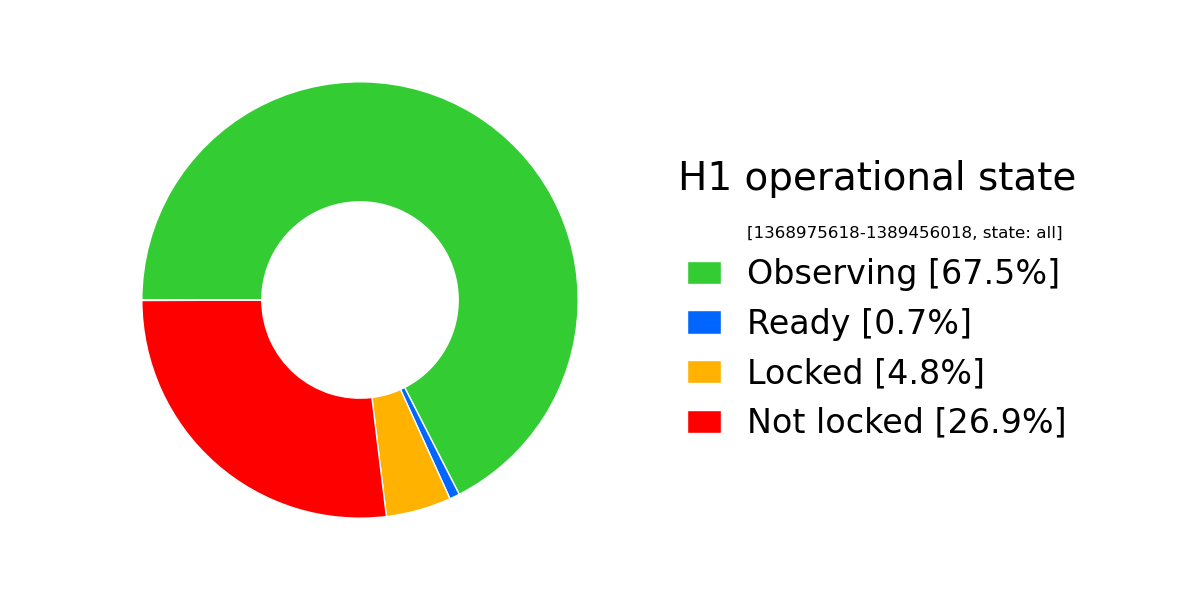
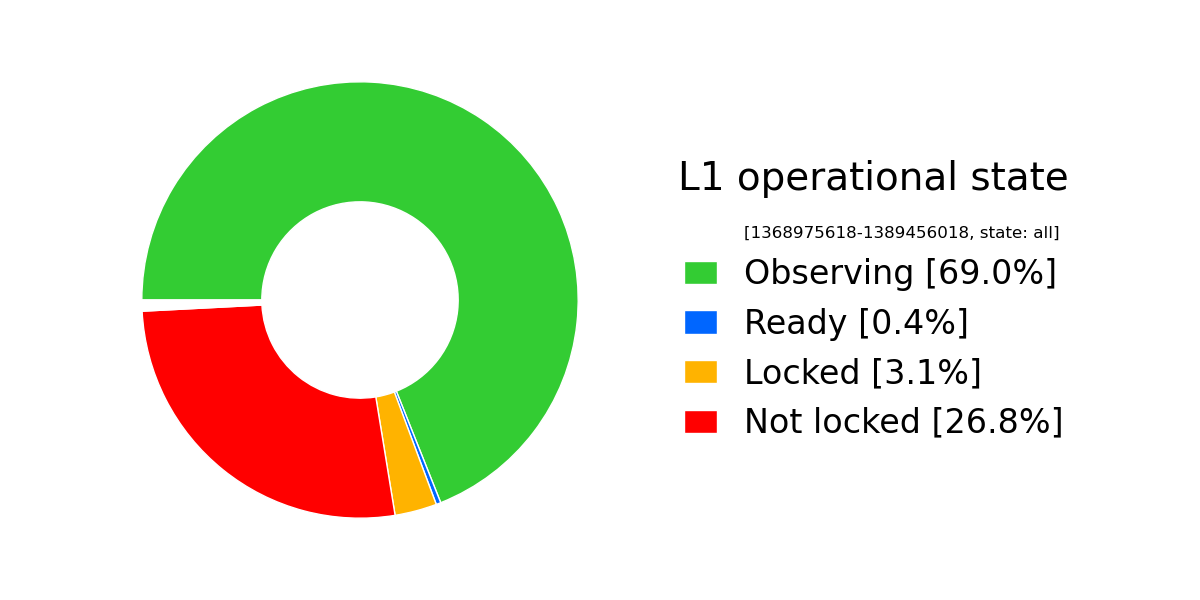
The plots shown below characterize the sensitivity and status of each of the LIGO interferometers during the first half of the fourth observing run, known as O4a, which began on May 24, 2023 and ended January 16, 2024. For more information about the plots listed below, click on an image to read the caption.

This page is a product of the Gravitational Wave Open Science Center. See gw-openscience.org for more information.