Instructions
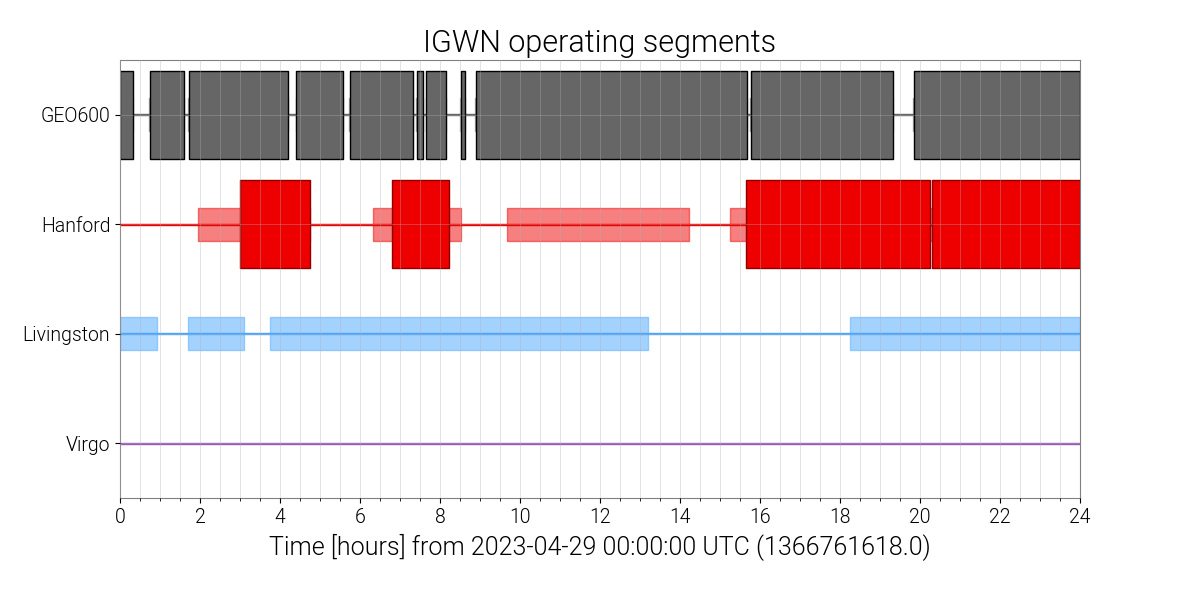
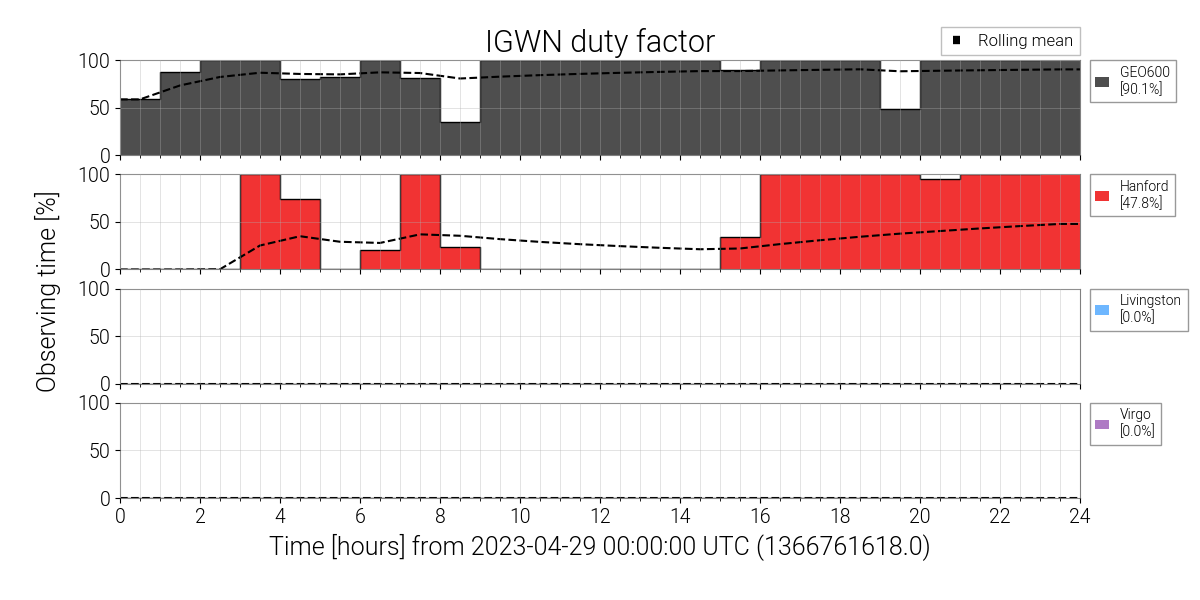
This tool is designed to help visually correlate multiple types of data by
laying transparent figures atop one another. To use it, follow these steps:
- From the main page(s), drag-and-drop figures onto the button with this icon:
- Expand this dialog box and use the
Overlay button (to the right) to render
a new figure by overlaying the ones selected
- Add more figures using the steps above, click
Overlay to re-render, and
use the Download button to save to a local file
- Use the
Clear button to clear all figure selections
Note: figures are remembered across tabs, so multiple times and subsystems
can be compared at once.


