Overlay figures for easy comparison


Instructions

This tool is designed to help visually correlate multiple types of data by laying transparent figures atop one another. To use it, follow these steps:

  • From the main page(s), drag-and-drop figures onto the button with this icon:
  • Expand this dialog box and use the Overlay button (to the right) to render a new figure by overlaying the ones selected
  • Add more figures using the steps above, click Overlay to re-render, and use the Download button to save to a local file
  • Use the Clear button to clear all figure selections

Note: figures are remembered across tabs, so multiple times and subsystems can be compared at once.

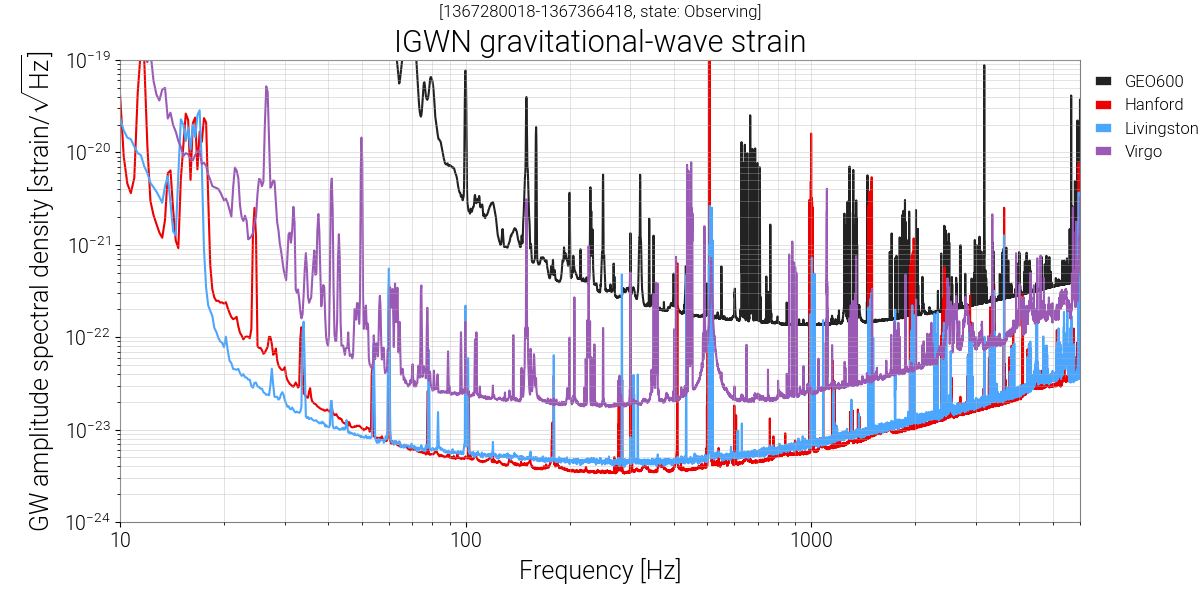
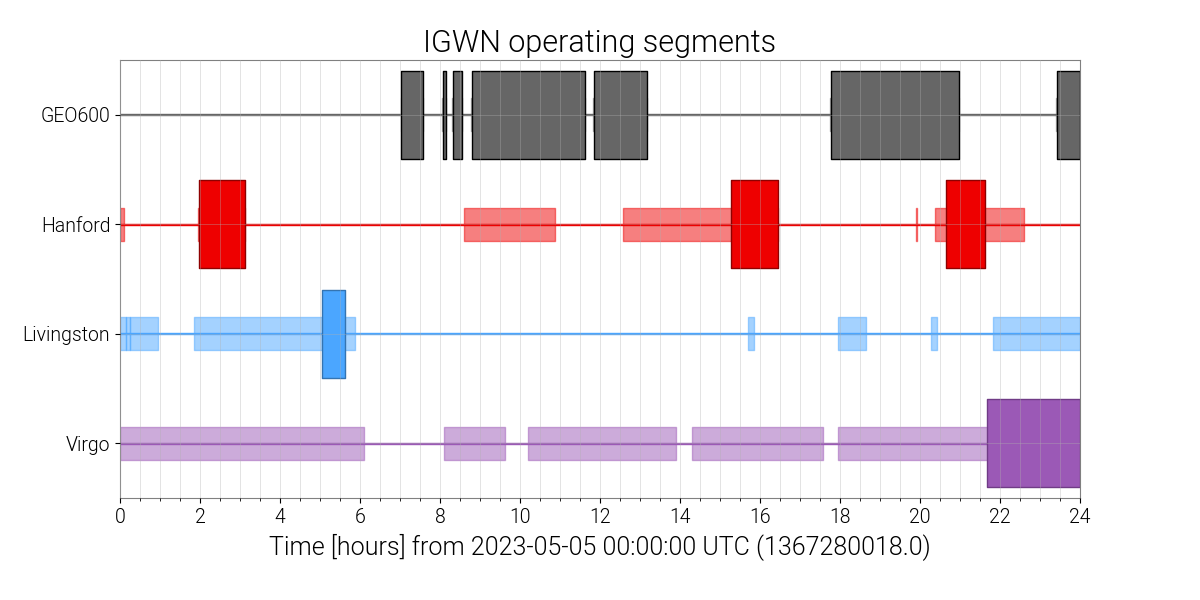
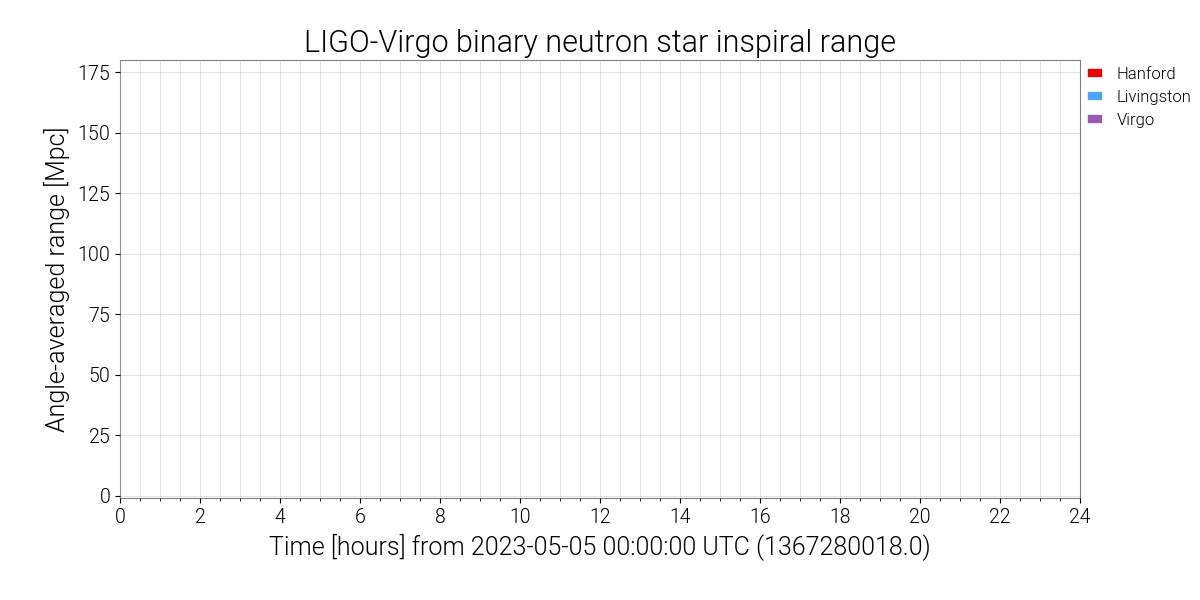
The plots shown below characterize the sensitivity and status of each of the LIGO interferometers as well as the Virgo detector in Cascina, Italy and the GEO600 detector in Hanover, Germany.
For more information about the plots listed below, click on an image to read the caption. Use the tabs in the navigation bar at the top of the screen for more detailed information about the LIGO, Virgo, and GEO interferometers.

This page is a product of the Gravitational Wave Open Science Center. See gw-openscience.org for more information. Note that some information on these pages may be missing or incomplete.