Overlay figures for easy comparison


Instructions

This tool is designed to help visually correlate multiple types of data by laying transparent figures atop one another. To use it, follow these steps:

  • From the main page(s), drag-and-drop figures onto the button with this icon:
  • Expand this dialog box and use the Overlay button (to the right) to render a new figure by overlaying the ones selected
  • Add more figures using the steps above, click Overlay to re-render, and use the Download button to save to a local file
  • Use the Clear button to clear all figure selections

Note: figures are remembered across tabs, so multiple times and subsystems can be compared at once.

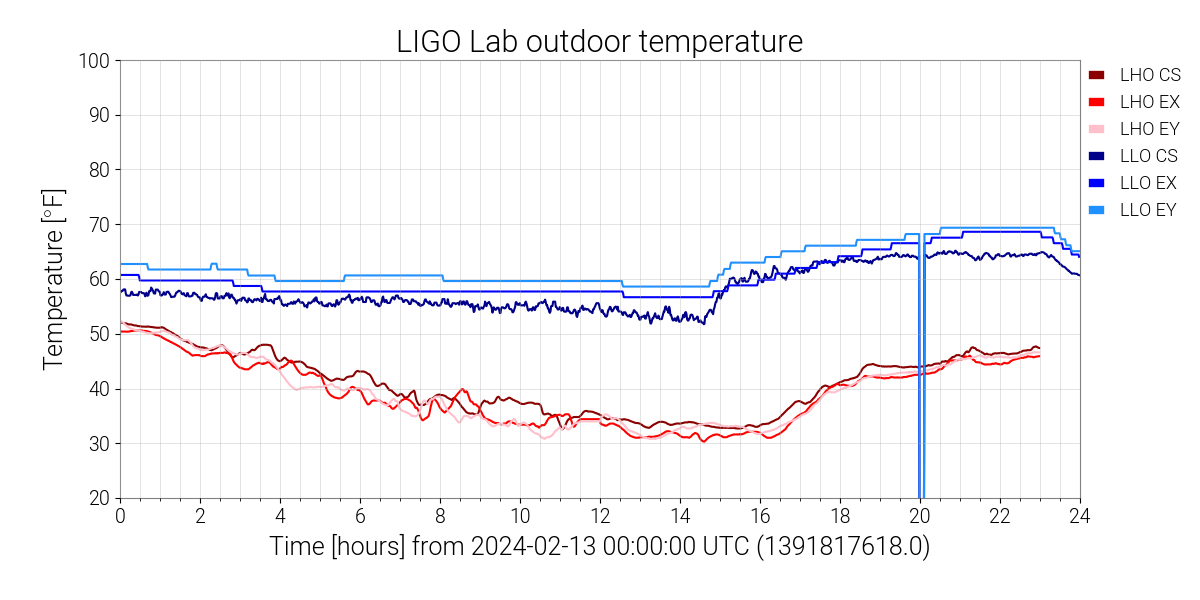
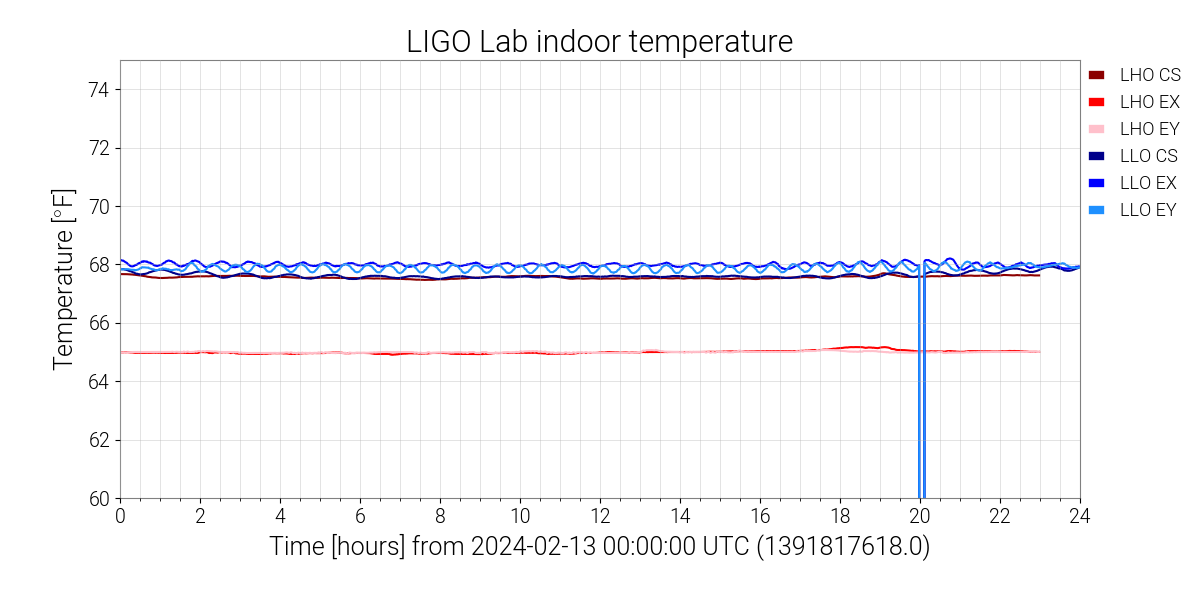
These plots show the indoor and outdoor temperatures at the LIGO Livingston and LIGO Hanford Observatories as measured by thermometers located at the end of the X-arm (EX), the end of the Y-arm (EY), and the corner station (CS; near the beam splitter, where the X- and Y-arms meet). Any extreme dips in these plots are likely due to gaps in recorded data rather than rapid temperature swings.