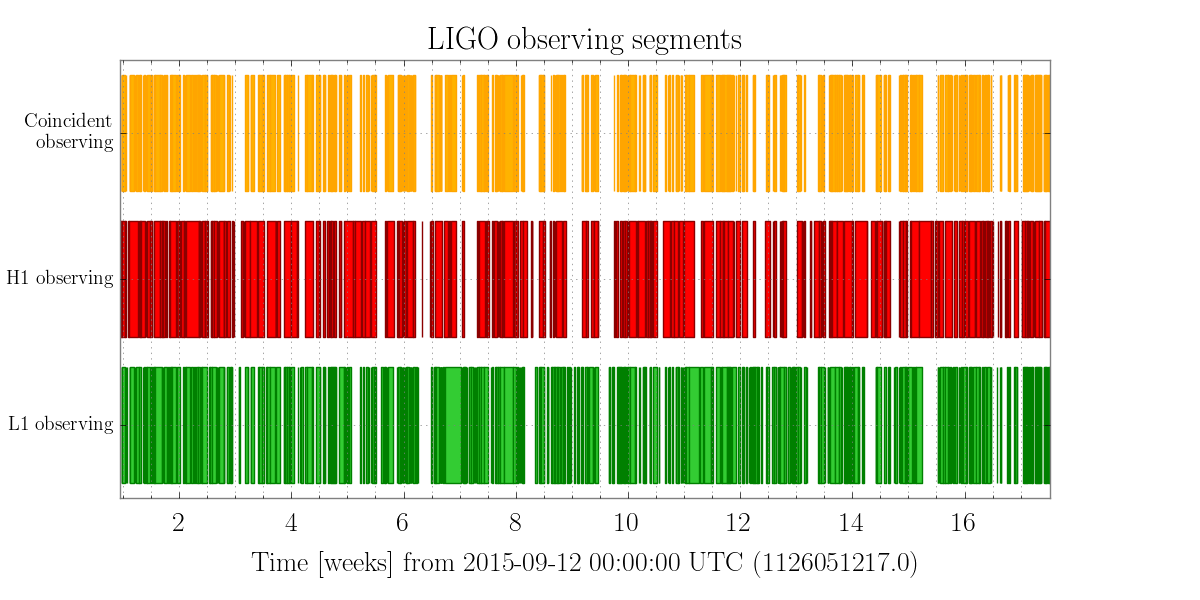
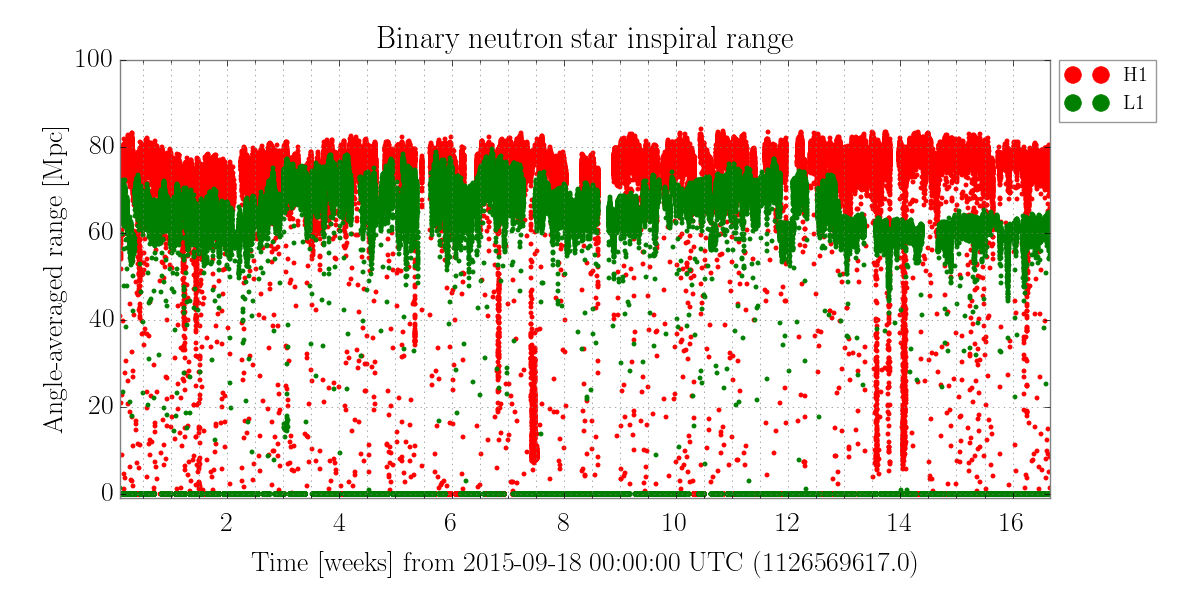
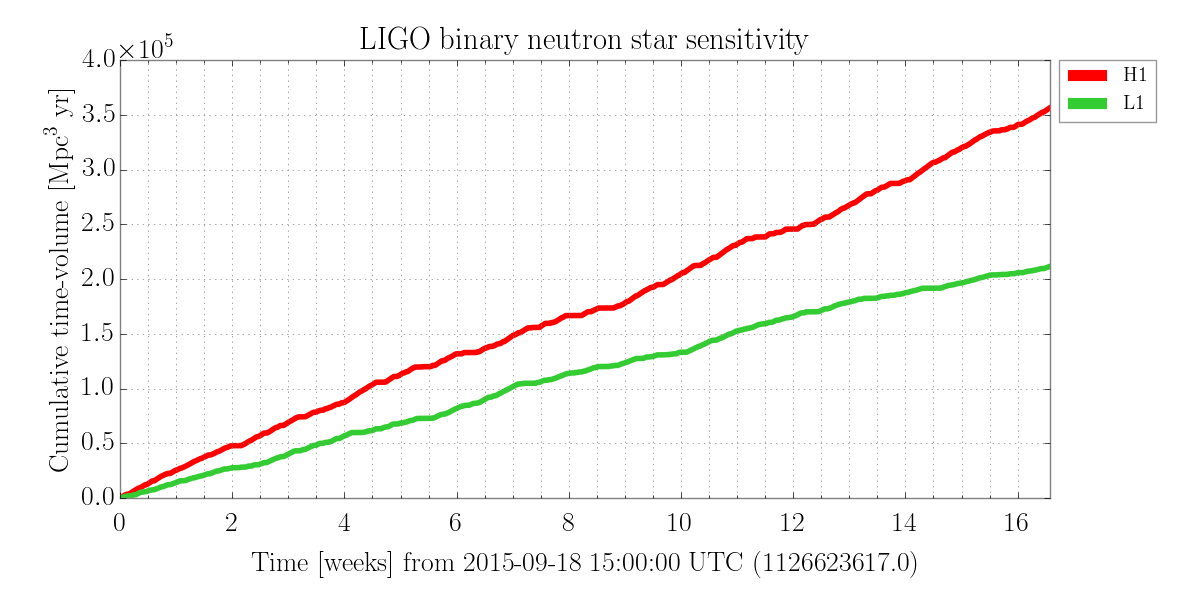
The plots shown below characterize the sensitivity and performance of each of the LIGO sites during the first observing run of the Advanced LIGO era, which began on September 12, 2015 and ended on January 19, 2016. For more information about the plots listed below, click on an image to read the caption.
This page is a product of the LIGO Open Science Center. All data were recorded at the LIGO observatories in Hanford, Washington and Livingston, Louisiana, USA; see ligo.org for more information.


