Data release for event GW150914
This page has been prepared by the LIGO Scientific Collaboration (LSC) and the Virgo Collaboration to inform the broader community about a confirmed astrophysical event observed by the gravitational-wave detectors, and to make the data around that time available for others to analyze.
There is also a technical details page about the data linked below, and
feel free to contact us.
This dataset has the Digital Object Identifier (doi) https://doi.org/10.7935/K5MW2F23
Summary of Observation
The event occurred at GPS time 1126259462 == September 14 2015, 09:50:45 UTC.
The false alarm rate is estimated to be less than 1 event per 203,000 years, equivalent to a
significance of 5.1 sigma.
The event was detected in data from the
LIGO Hanford and
LIGO Livingston
observatories.
There are Science Summaries, covering the information below in ordinary language.
There is a one page factsheet about GW150914, summarizing the event.
How to Use this Page
- Click on the section headings below to show available data files.
- There are lots of data files available in the sections below, look for the word DATA.
- Click on each thumbnail image for larger image.
- See the papers linked below for full information, references, and meaning.
- Many of the data files linked below have heterogeneous formatting; if you have any questions, please
contact us.
The G150914 detection paper:
For full details see
LIGO DCC,
arXiv, or
Phys. Rev. Letters
See also the paper "Binary Black Hole Mergers in the First Advanced LIGO Observing Run",
LIGO DCC,
arXiv,
or
Phys. Rev. X.
The Estimated source parameters below have been updated to come from this latter paper.
These papers and all the companion papers can also be found at
papers.ligo.org.
Estimated source parameters
| Quantity | Value | Upper/Lower error
estimate | Unit |
|---|
| Primary black hole mass | 36.2 | +5.2 -3.8 | M sun |
| Secondary black hole mass | 29.1 | +3.7 -4.4 | M sun |
| Final black hole mass | 62.3 | +3.7 -3.1 | M sun |
| Final black hole spin | 0.68 | +0.05 -0.06 | |
| Luminosity distance | 420 | +150 -180 | Mpc |
| Source redshift, z | 0.09 | +0.03 -0.04 | |
| Energy radiated | 3.0 | +0.5 -0.4 | M sun |
TABLE I. Estimated source parameters for GW150914. We report
the median value as well as the range of the 90% credible
interval. Masses are measured in the source frame; to convert
masses to detector frame, multiply by (1 + z). The source
redshift assumes standard cosmology.
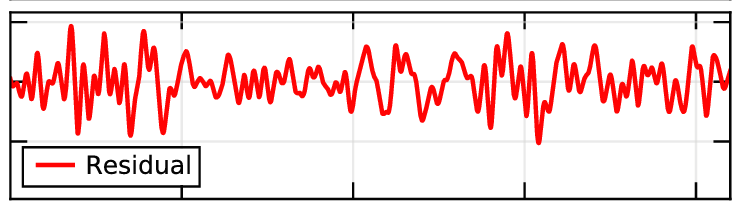
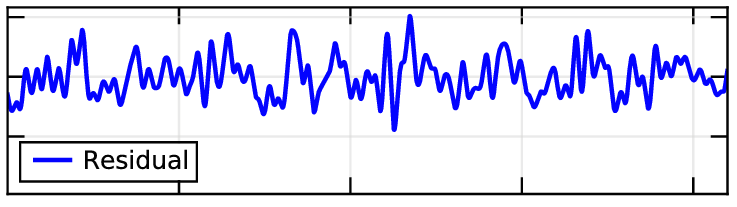
Note: The numerical relativity waveform that was subtracted
to make these figures is consistent
with the parameter ranges inferred for GW150914, as noted in the figure
caption, but was not tuned to precisely remove the signal. A bit of residual
signal, with amplitude smaller than the visible noise, remains in each of these 'Residual' plots.
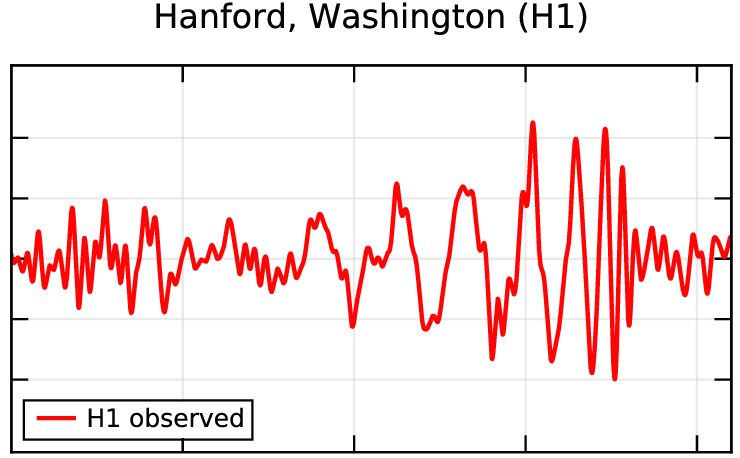
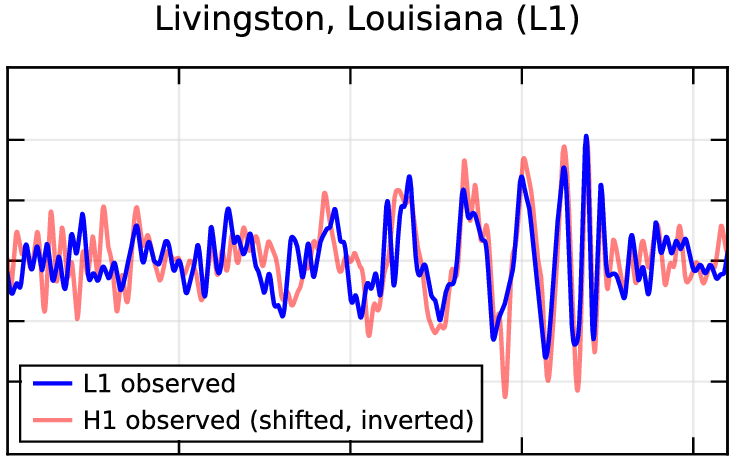
FIG. 1. The gravitational-wave event GW150914 observed by the LIGO Hanford (H1, left column panels) and Livingston (L1,
right column panels) detectors. Times are shown relative to September 14, 2015 at 09:50:45 UTC. For visualization, all time series
are filtered with a 35–350 Hz band-pass filter to suppress large fluctuations outside the detectors’ most sensitive frequency band, and
band-reject filters to remove the strong instrumental spectral lines seen in the Fig. 3 spectra.
- Top row, left: H1 strain. Top row, right: L1
strain. GW150914 arrived first at L1 and 6.9 (+0.5 −0.4) ms later at H1; for a visual comparison the H1 data are also shown, shifted in time
by this amount and inverted (to account for the detectors’ relative orientations).
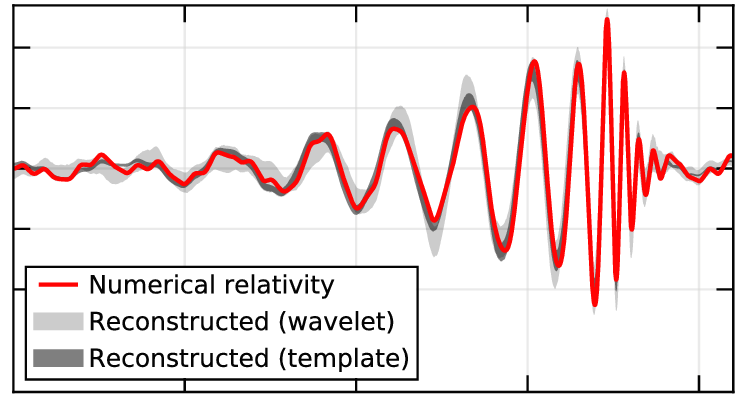
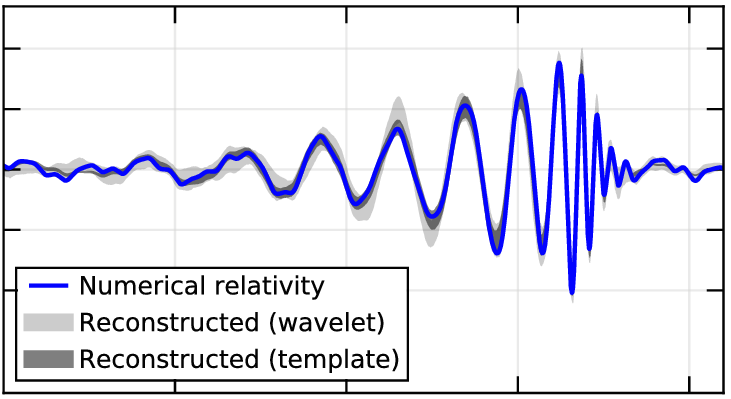
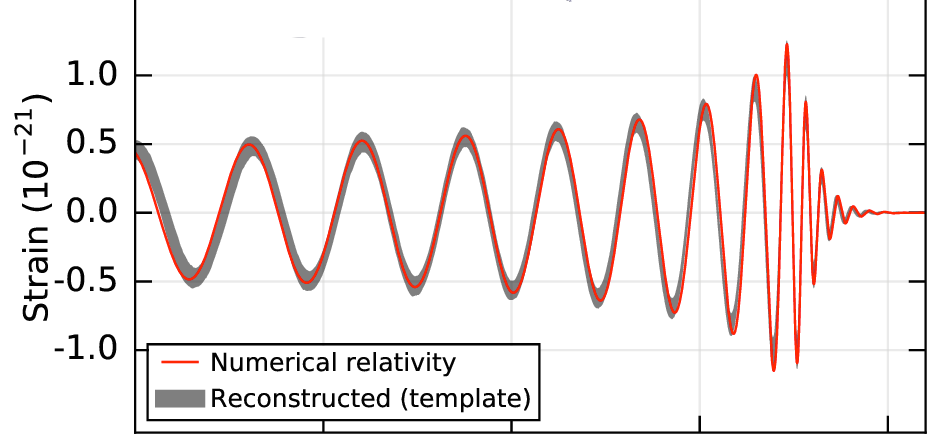
- Second row: Gravitational-wave strain projected onto
each detector in the 35–350 Hz band. Solid lines show a numerical relativity waveform for a system with parameters consistent with
those recovered from GW150914 confirmed by an independent calculation. Shaded areas show 90% credible
regions for two waveform reconstructions: one that models the signal as a set of sine-Gaussian wavelets and one that models
the signal using binary-black-hole template waveforms. These reconstructions have a 95% overlap.
- Third row: Residuals after subtracting the filtered numerical relativity waveform from the filtered detector time series.
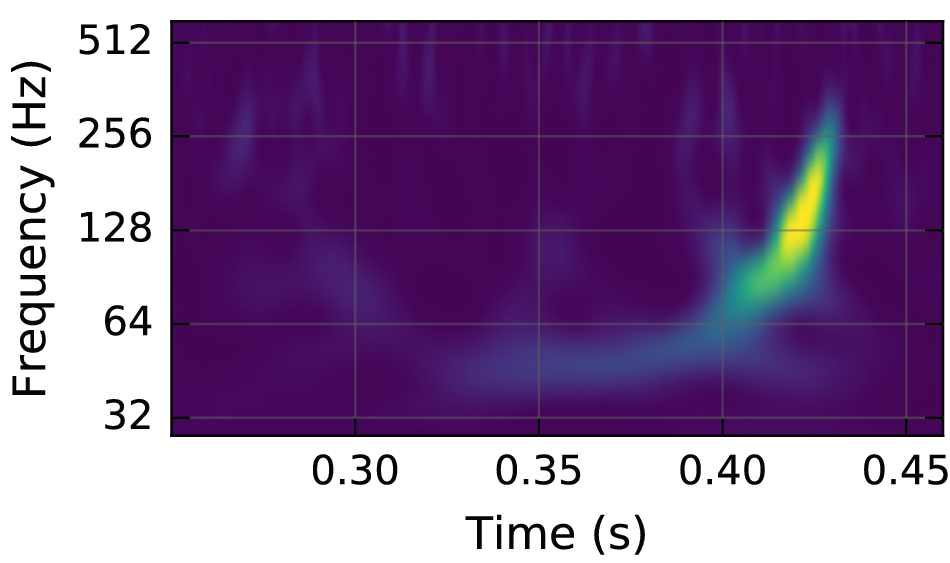
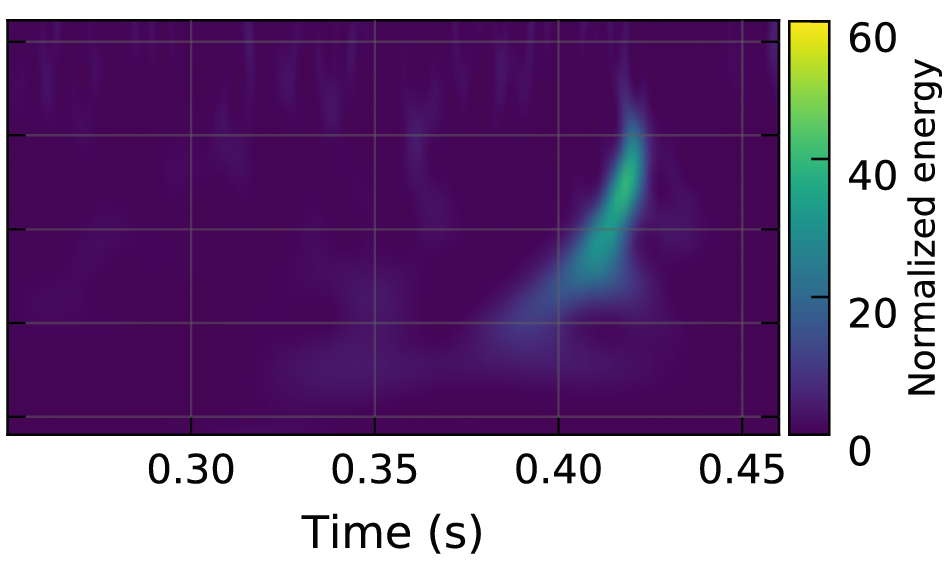
- Bottom row: A time-frequency
decomposition of the signal power associated with GW150914. Both plots show a signal with frequency increasing with time.
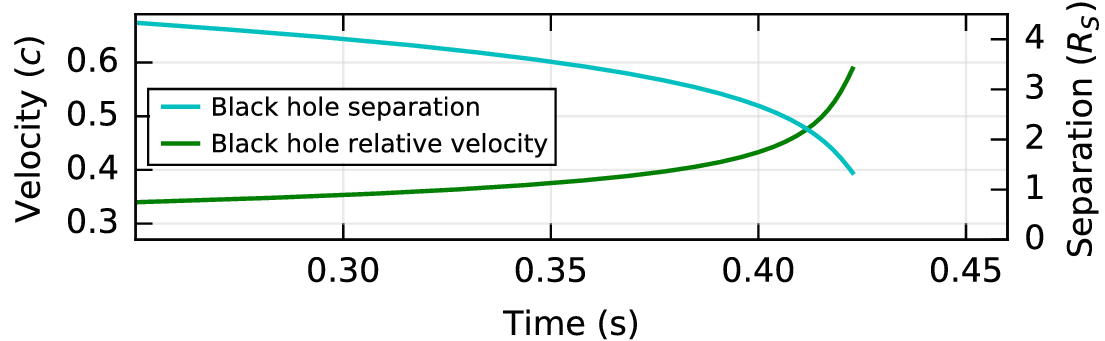
FIG. 2. Left: Estimated gravitational-wave strain amplitude
from GW150914 projected onto H1. This shows the full bandwidth
of the waveforms, without the filtering used for Fig. 1.
Right: The Keplerian
effective black hole separation in units of Schwarzschild
radii and the effective relative velocity.
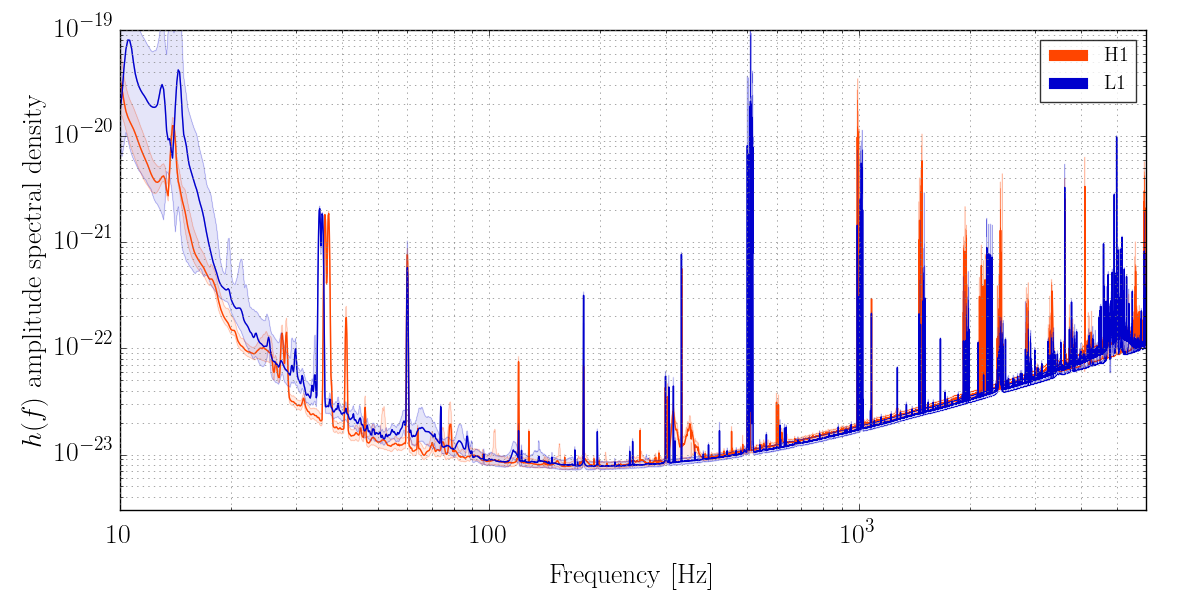
FIG.3. The average measured strain-equivalent noise, or sensitivity, of the Advanced
LIGO detectors during the time analyzed to determine the significance of
GW150914 (Sept 12 - Oct 20, 2015). Hanford (H1) is shown in red, Livingston
(L1) in blue. The solid traces represent the median sensitivity and the shaded
regions indicate the 5th and 95th percentile over the analysis period. The
narrowband features in the spectra are due to known mechanical resonances,
mains power harmonics, and injected signals used for calibration.
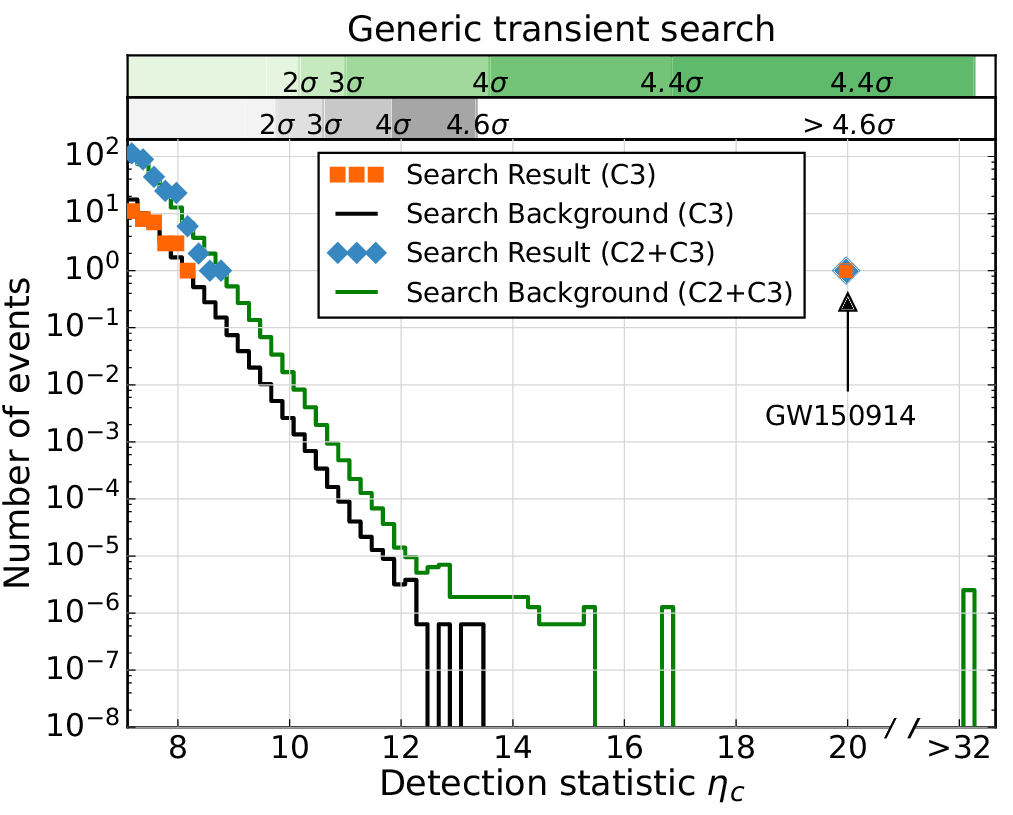
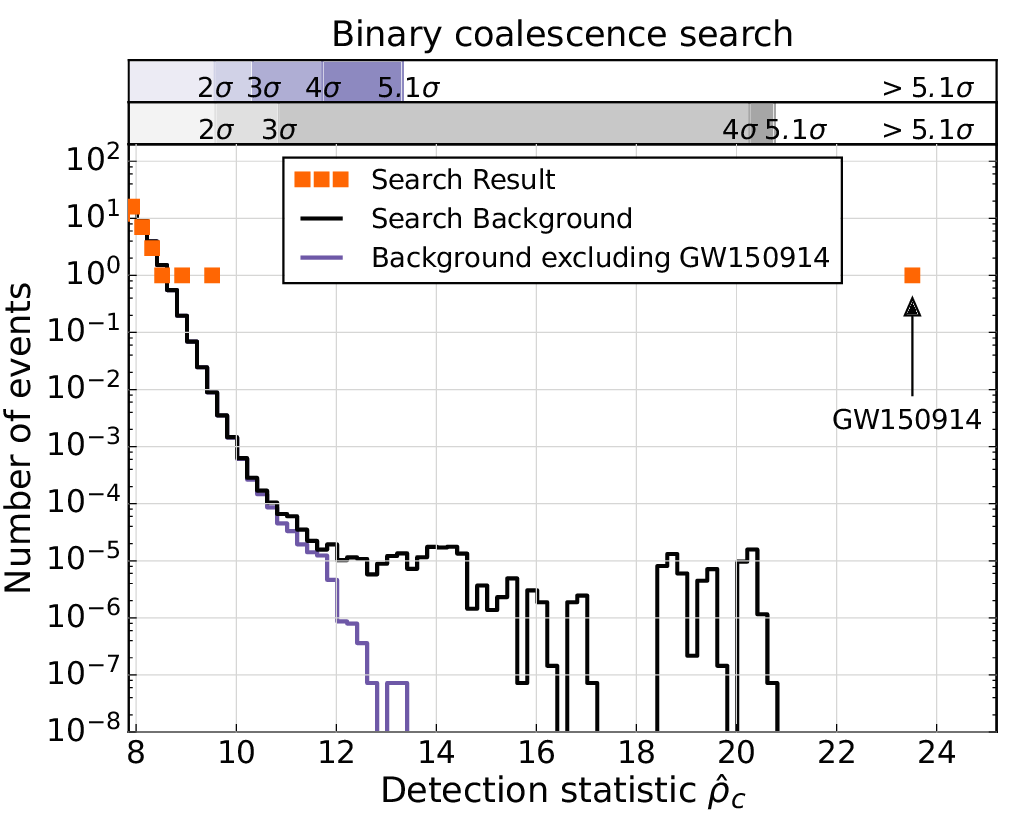
FIG. 4. Search results from the generic transient search (left) and the binary coalescence search (right). These histograms show the
number of candidate events (orange markers) and the mean number of background events in the search class where GW150914 was
found (black lines) as a function of the search detection statistic and with a bin width of 0.2. The scales on the top give the significance of
an event in Gaussian standard deviations based on the corresponding noise background . The significance of GW150914 is greater than
5.1 σ and 4.6 σ for the binary coalescence and the generic transient searches, respectively. (Left): Along with the primary search (C3) we
also show the results (yellow markers) and background (green curve) for an alternative search that treats events independently of their
frequency evolution (C2+C3). The classes C2 and C3 are defined in the text. (Right): The tail in the black-line background of the binary
coalescence search is due to random coincidences of GW150914 in one detector with noise in the other detector. (This type of event
is practically absent in the generic transient search background because they do not pass the time-frequency consistency requirements
used in that search.) The blue curve is the background excluding those coincidences, which is used to assess the significance of the
second strongest event candidate.
The data from the observatories from which the science is derived:
- Data usage notes Please Read This First!
- The data are provided in three formats.
HDF5 ,
Frame (.gwf),
and gzipped ascii text.
Many data analysis environments
can read in data from HDF5 files,
including Python (see the h5py
package), MATLAB, C/C++, and IDL.
- The md5 checksums provide a check for downloaders that they have received the right file: run the Unix command "md5" (or "md5sum", depending on your OS) on your file and compare to LOSC published values. If different, try downloading again, and if the problem persists, contact us.
- Technical details especially about data quality and injections
- Tutorials to work with the strain data.
Strain Data at 4096 Hz
Strain h(t) time series centered at GPS 1126259462:
Strain Data at 16384 Hz
Strain h(t) time series centered at GPS 1126259462:
The numerical relativity waveform used in this tutorial can be obtained as a plain-text file,
here,
where the first column is the time in seconds relative to the peak of the waveform,
and the second column is the (unitless) strain. This waveform was obtained from
the SXS Gravitational Waveform Database, courtesy of the SXS
Collaboration (please see Acknowledgements in that link). It corresponds to waveform ID SXS:BBH:0305,
with mass ratio m1/m2 = 1.221 and aligned spins. Its time axis has been rescaled for a system
with detector frame total mass of 74.6 solar masses, and the overall amplitude and phase are adjusted,
all to get good agreement with the data at both detectors.
The LIGO Observatory
The Laser Interferometer Gravitational-Wave Observatory (LIGO)
consists of two widely separated installations within the United
States — one in Hanford, Washington and the other in Livingston,
Louisiana — operated in unison as a single observatory. LIGO is
operated by the LIGO
Laboratory, a consortium of the California Institute of Technology
(Caltech) and the Massachusetts
Institute of Technology (MIT). Funded by the National Science Foundation, LIGO is an
international resource for both physics and astrophysics.
The GEO600 Detector
The GEO600 project aims at the
direct detection of gravitational waves by means of a laser
interferometer of 600 m armlength located near Hannover, Germany.
Besides collecting data for gravitational wave searches, the GEO600
detector has been used to develop and test advanced instrumentation for
gravitational wave detection.
The LIGO Scientific Collaboration
The LIGO Scientific Collaboration
(LSC) is a group of scientists
seeking to make the first direct detection of gravitational waves, use
them to explore the fundamental physics of gravity, and develop the
emerging field of gravitational wave science as a tool of astronomical
discovery. The LSC works toward this goal through research on, and
development of techniques for, gravitational wave detection, and the
development, commissioning and exploitation of gravitational wave
detectors.
The LSC carries out the science of the LIGO and GEO600 Observatories.
Participation in the LSC is open to all interested
scientists and engineers from educational and research institutions.
For full details see
LIGO DCC or
arXiv.
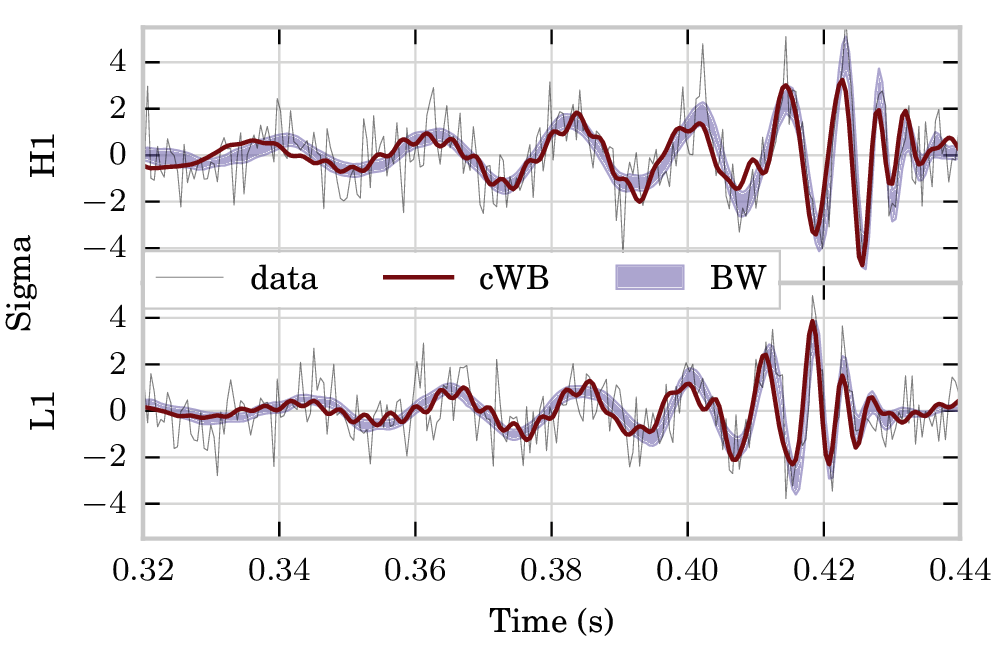
Figure 10: The cWB point estimate for the waveform and the
90% credible interval from the BW analysis. The reconstructed
waveforms and shown data are whitened using estimated
noise curves for each detector at the time of the event.
For full details see
LIGO DCC or
arXiv
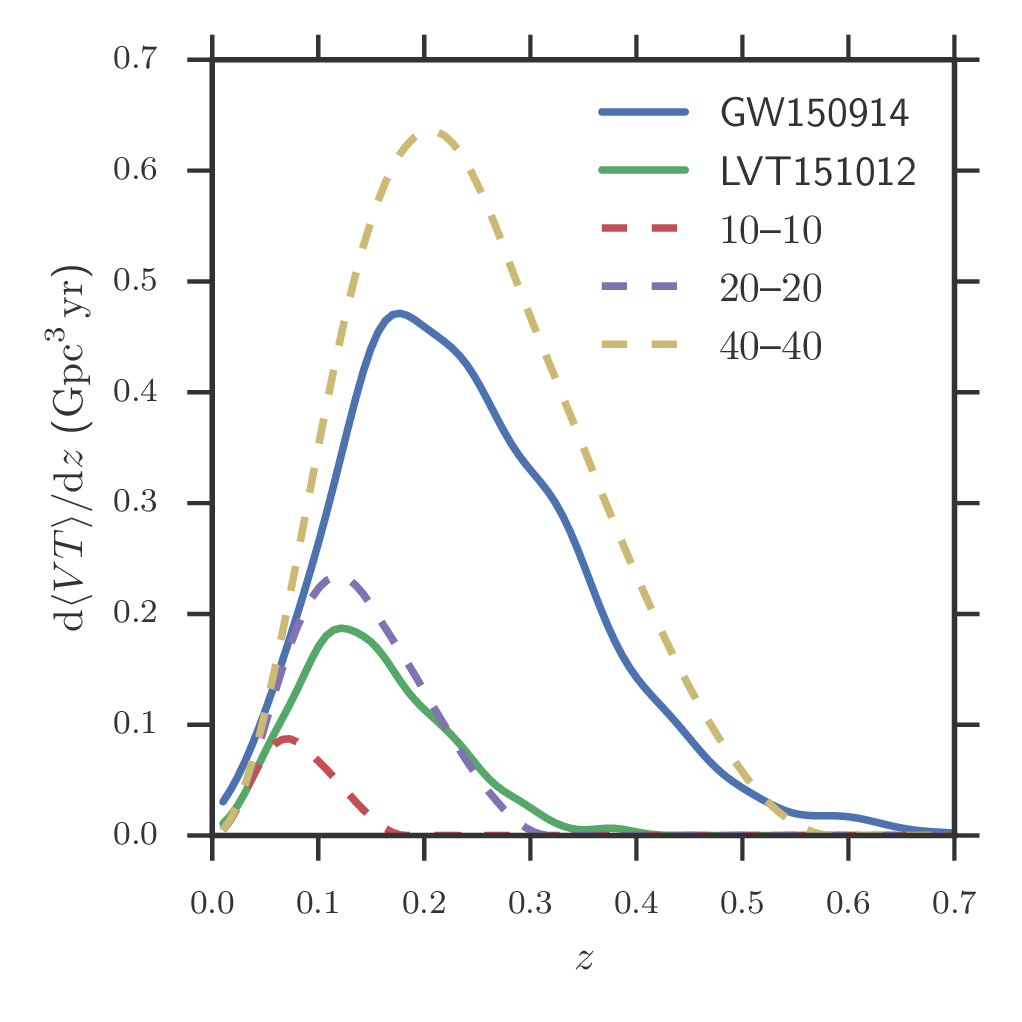
FIG 3. The rate at which sensitive time-volume accumulates
with redshift.
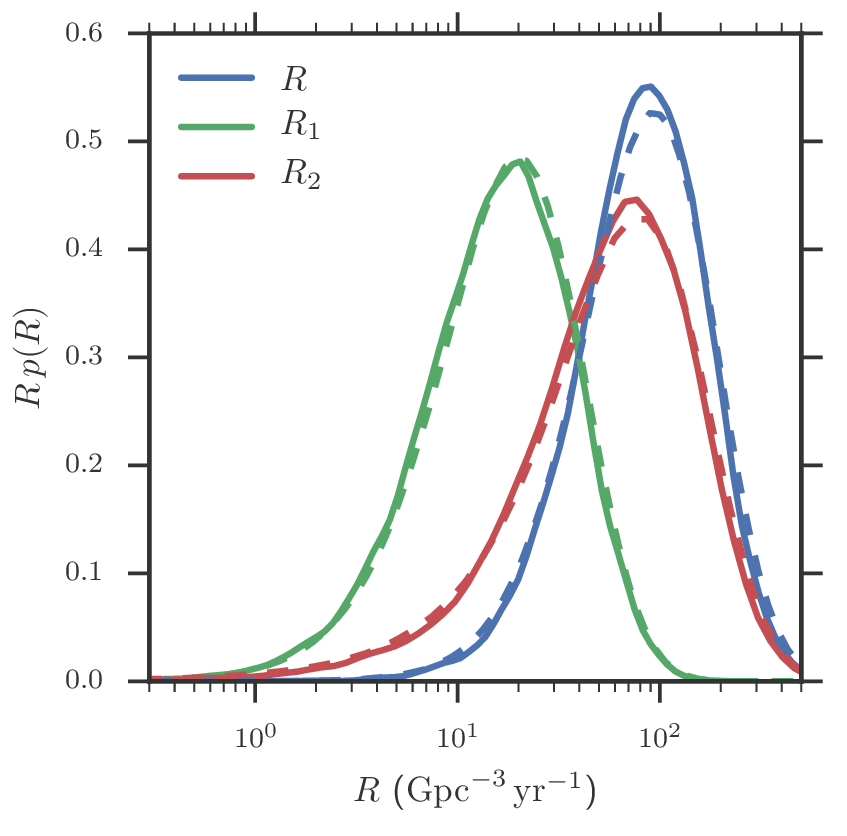
FIG 4. The posterior density on the rate of
GW150914-like BBH inspirals, R1 (green), G197392-like
BBH inspirals, R2 (red), and the inferred total rate,
R = R1 + R2 (blue).
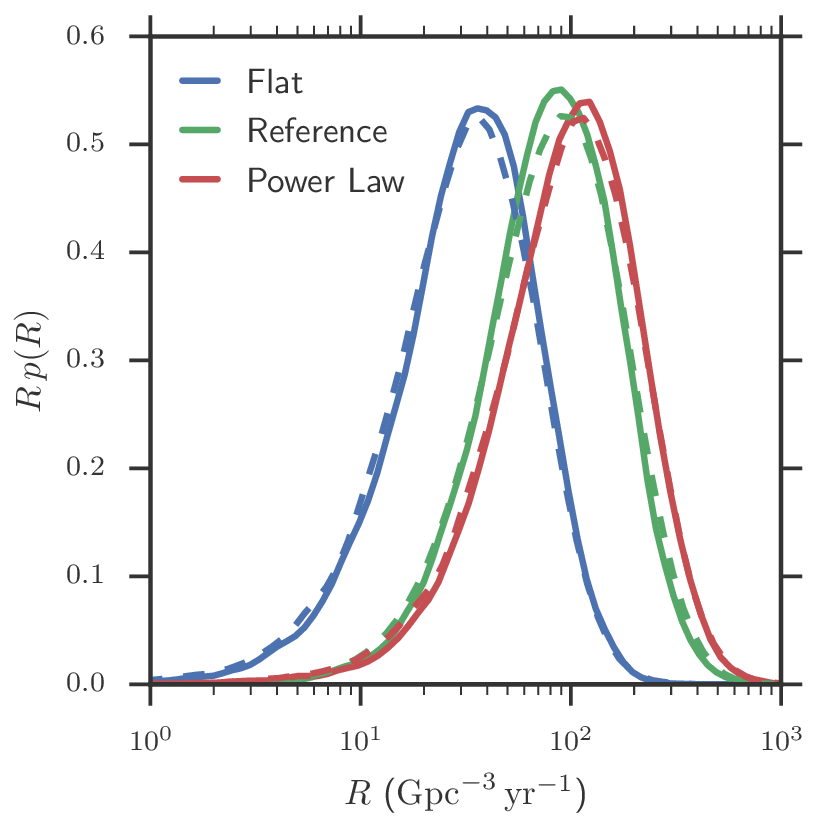
FIG 5. Sensitivity of the inferred BBH coalescence rate to the
assumed astrophysical distribution BBH masses. The curves represent
the posterior assuming that BBH masses are flat in log (m1)- log (m2) (blue; “Flat”), are exactly GW150914-like or G197392-
like as described in Section 2 (green; “Reference”), or are distributed as in Eq. (20) (red; “Power Law”).
For full details see
LIGO DCC
or
arXiv
or
Phys. Rev. Letters.
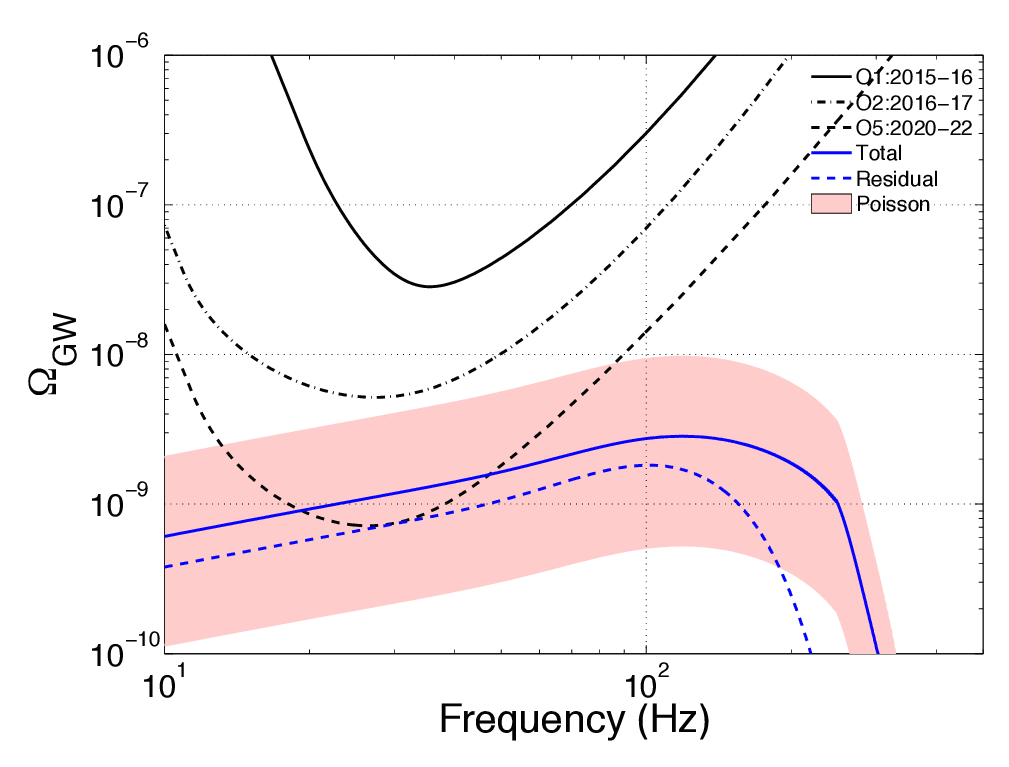
FIG. 1: Expected sensitivity of the network of advanced LIGO and Virgo detectors to the Fiducial field model.
Energy density spectra are shown in blue (solid for the total background; dashed for the residual background assuming final advanced
LIGO and Virgo sensitivity). The pink shaded region shows the 90% CL statistical uncertainty propagated from the local
rate measurement. The black curves are power-law integrated sensitivities for the network expected for the two first observing
runs O1 and O2, and for 2 years at the design sensitivity in O5 (O3 and O4 are not significantly different than O5); see Table I.
If the astrophysical background spectrum intersects a black line, it has expected SNR ≥ 1.
For full details see
LIGO DCC or
arXiv.
FIG.1 The average measured strain-equivalent noise, or sensitivity, of the Advanced
LIGO detectors during the time analyzed to determine the significance of
GW150914 (Sept 12 - Oct 20, 2015). Hanford (H1) is shown in red, Livingston
(L1) in blue. The solid traces represent the median sensitivity and the shaded
regions indicate the 5th and 95th percentile over the analysis period. The
narrowband features in the spectra are due to known mechanical resonances,
mains power harmonics, and injected signals used for calibration
Sky location probability maps
For full details see
LIGO DCC.
Four pipelines produced sky localization information, known as
CWB,
LIB,
BAYESTAR,
and LALInference.
Their sky coverage comparison is shown below, in equatorial coordinates:
 |
 |
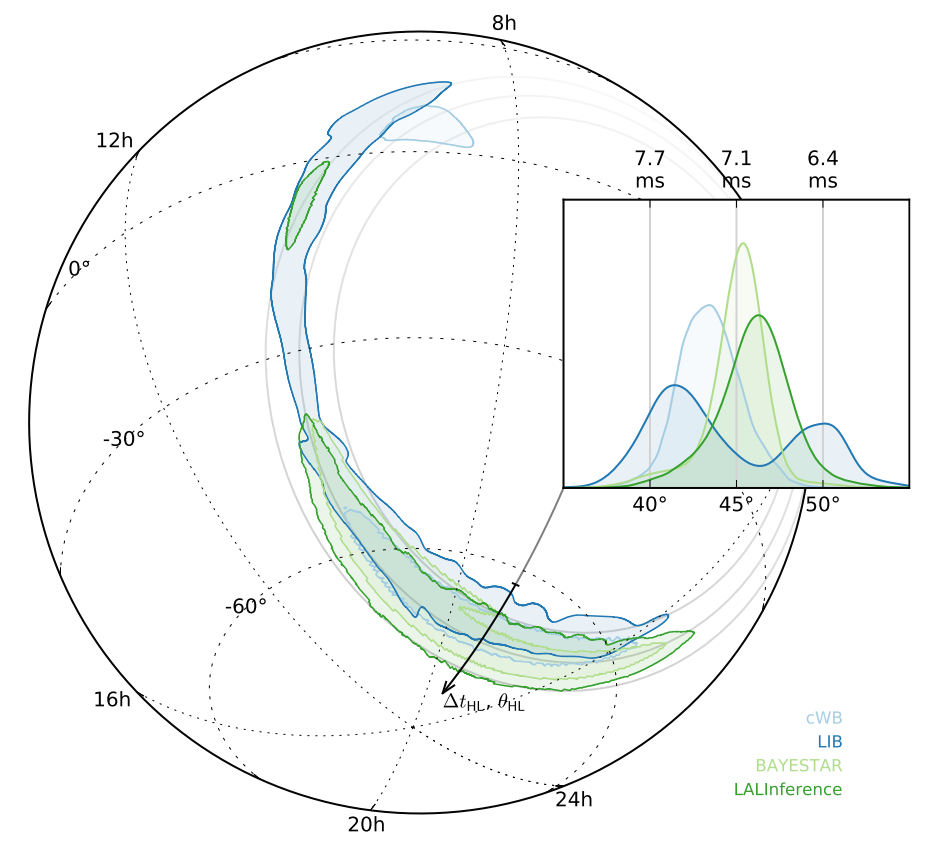
| Comparison of different GW sky maps, showing the 90% credible level contours for each algorithm. This orthographic projection
centered on the centroid of the LIB localization.
The inset shows the distribution of the polar angle θHL (equivalently, the arrival time difference ∆tHL).
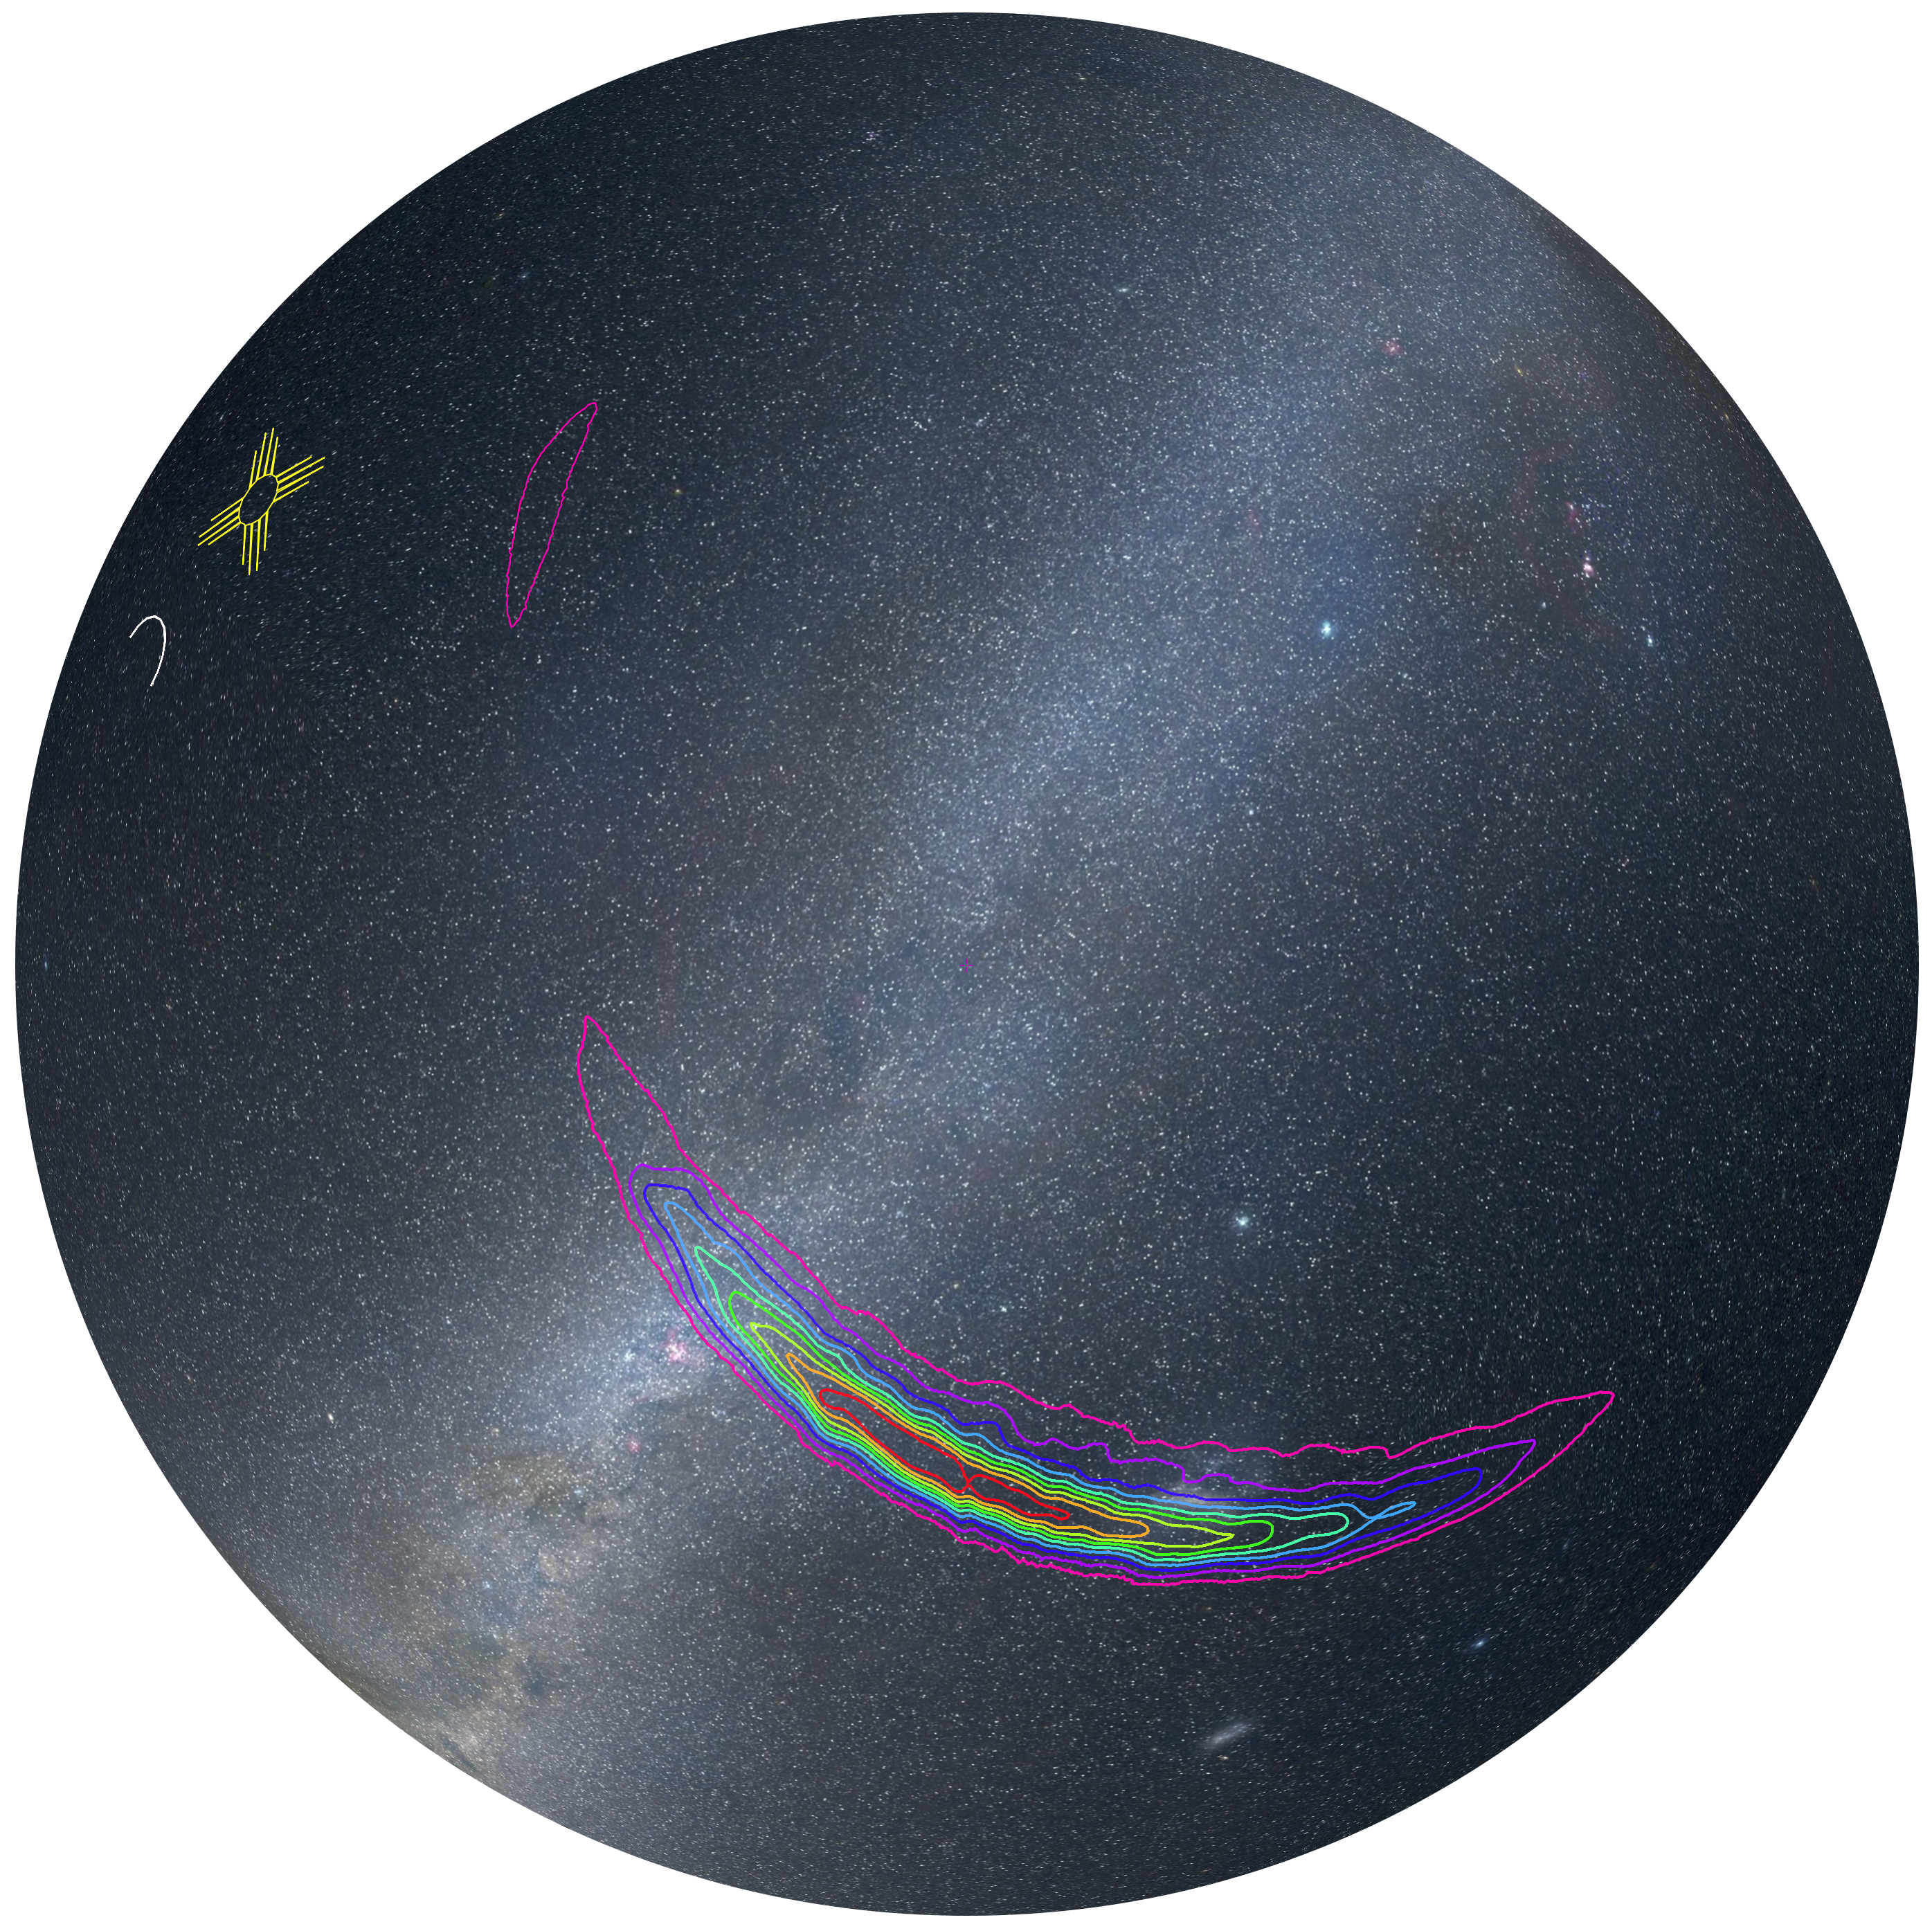
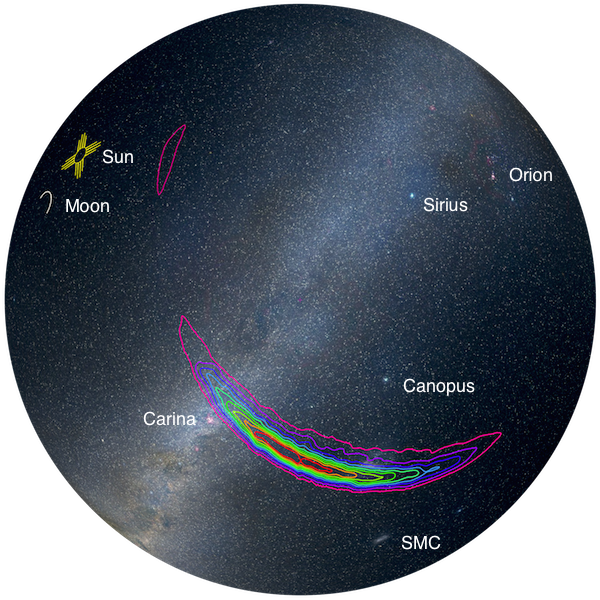
| Sky at the time of the event, with the LALInference skymap, contoured in deciles of probability. View is from the South Atlantic Ocean, North at the top, with the Sun rising and the Milky Way diagonally from NW to SE. |
The skymaps can be visualized in astronomical context with the Skymap Viewer, as in the right-hand image:
CWB,
LIB,
BAYESTAR,
LALInference.
The skymaps are represented as HEALPIX-FITS files in equatorial frame, available gzipped:
A python library for reading such files is
healpy.
A very simple healpy code to work with LIGO-Virgo skymaps is
here.
A large number of simulated skymaps is available
here.
Files are in wav format, with data whitened and band-passed to 20 - 300 Hz.
These files can be generated from the data using the GW150914 tutorial that is linked above.
- Observed waveform, whitened and band-passed 20 Hz to 300 Hz, for
H1 and
L1.
- Observed waveform, whitened and band-passed 20 Hz to 300 Hz, and shifted up by 400 Hz, for
H1 and
L1.
- Observed waveform, whitened and band-passed 40 Hz to 400 Hz, and shifted up by 200 Hz, for
H1 and
L1.
- Best fit theoretical waveform, whitened and band-passed, and
whitened and shifted up by 400 Hz
- Median reconstructions of the event, and whitened. H in left channel, L in right channel:
BayesWave.
- Best-fit (MAP) waveforms from paper P1500218,
H in left channel, L in right channel:
Unwhitened and
whitened.
The following audio files have been produced from a newer tutorial (June 2016) entitled
"Tutorial on Signal Processing with Open Data from any O1 BBH event". See the
tutorials section
for more details.
- Hanford data
- Livingston data
- Best-fit template
There is a technical details page about the data linked above, and
feel free to contact us.
Revision History
- July 18, 2017: Added note explaining NR waveform is not precisely tuned.