LIGO, Virgo, GEO600 and KAGRA Data
Data Usage Notes. Please Read This First!
Gravitational wave data cannot be effectively used without understanding these features. See the links below for more details.
- 3 LIGO detectors operated during LIGO science run 5 (S5, Nov 2005 to Oct 2007):
-
2 LIGO detectors operated from 2009 onwards, during LIGO science run
6 (S6, Jul 2009 to Oct 2010) and LIGO observing runs 1 (O1, Sep 2015 to Jan
2016), 2 (O2, Nov 2016 to Aug 2017) and 3 (O3, Apr 2019 to Mar 2020):
- H1 at Hanford, Washington, and L1 at Livingston, Louisiana.
-
The Virgo detector (V1)
operated from 2007 onwards, with an overlap with the LIGO science runs 5 and
6, and the LIGO observing run 2 (O2) and 3 (O3):
- V1 at Cascina, Italy
- Initial LIGO was upgraded to Advanced LIGO, which began operating in 2015.
- Initial Virgo was upgraded to Advanced Virgo, which began operating in 2017.
- GEO600 (G1) and KAGRA (K1) operated a joint run, called O3GK, between the 7th April 2020 and the 21st April 2020.
- LIGO and Virgo detector positions are as recorded in LALSuite
- Injections in the data are simulated versions of astrophysical signals.
- If you 'discover' an interesting signal in GWOSC data, it could be a known injection.
- Lists of injection times are available for the S5, S6, O1, O2, O3a and O3b data sets.
- Instrumental glitches are in the data. They are not astrophysical in origin, but can mimic such signals. More information is available on the data release documentation pages or published papers (e.g. O1 data quality paper).
- Depending on the data set, the GWOSC strain data are available in the original 16384 Hz sample rate, or downsampled from 16384 Hz to 4096 Hz (see technical details pages for S5-S6, O1, O2, O3 and O3GK).
- Data quality categories are used to characterize the quality of data at a given time.
- Data which fails CAT 1 flags should not be searched for astrophysical signals.
- All data analysis by the LIGO Scientific Collaboration vetos data that fail CAT 1 or CAT 2 flags.
- See the data release documentation pages for details
- Instrumental lines in the data are detector artifacts seen at quasi-constant frequencies, and can mimic astrophysical signals.
- Gaps in the data occur when the detectors were not in their standard configuration (e.g., during maintenance).
- Short Segments: Standard signal processing methods applied to very short segments (<16 sec) must be used with caution and could produce spurious results.
-
Frequency dependent noise in the data is only roughly Gaussian.
- The noise spectrum also varies with time.
- See plots produced with our tutorials.
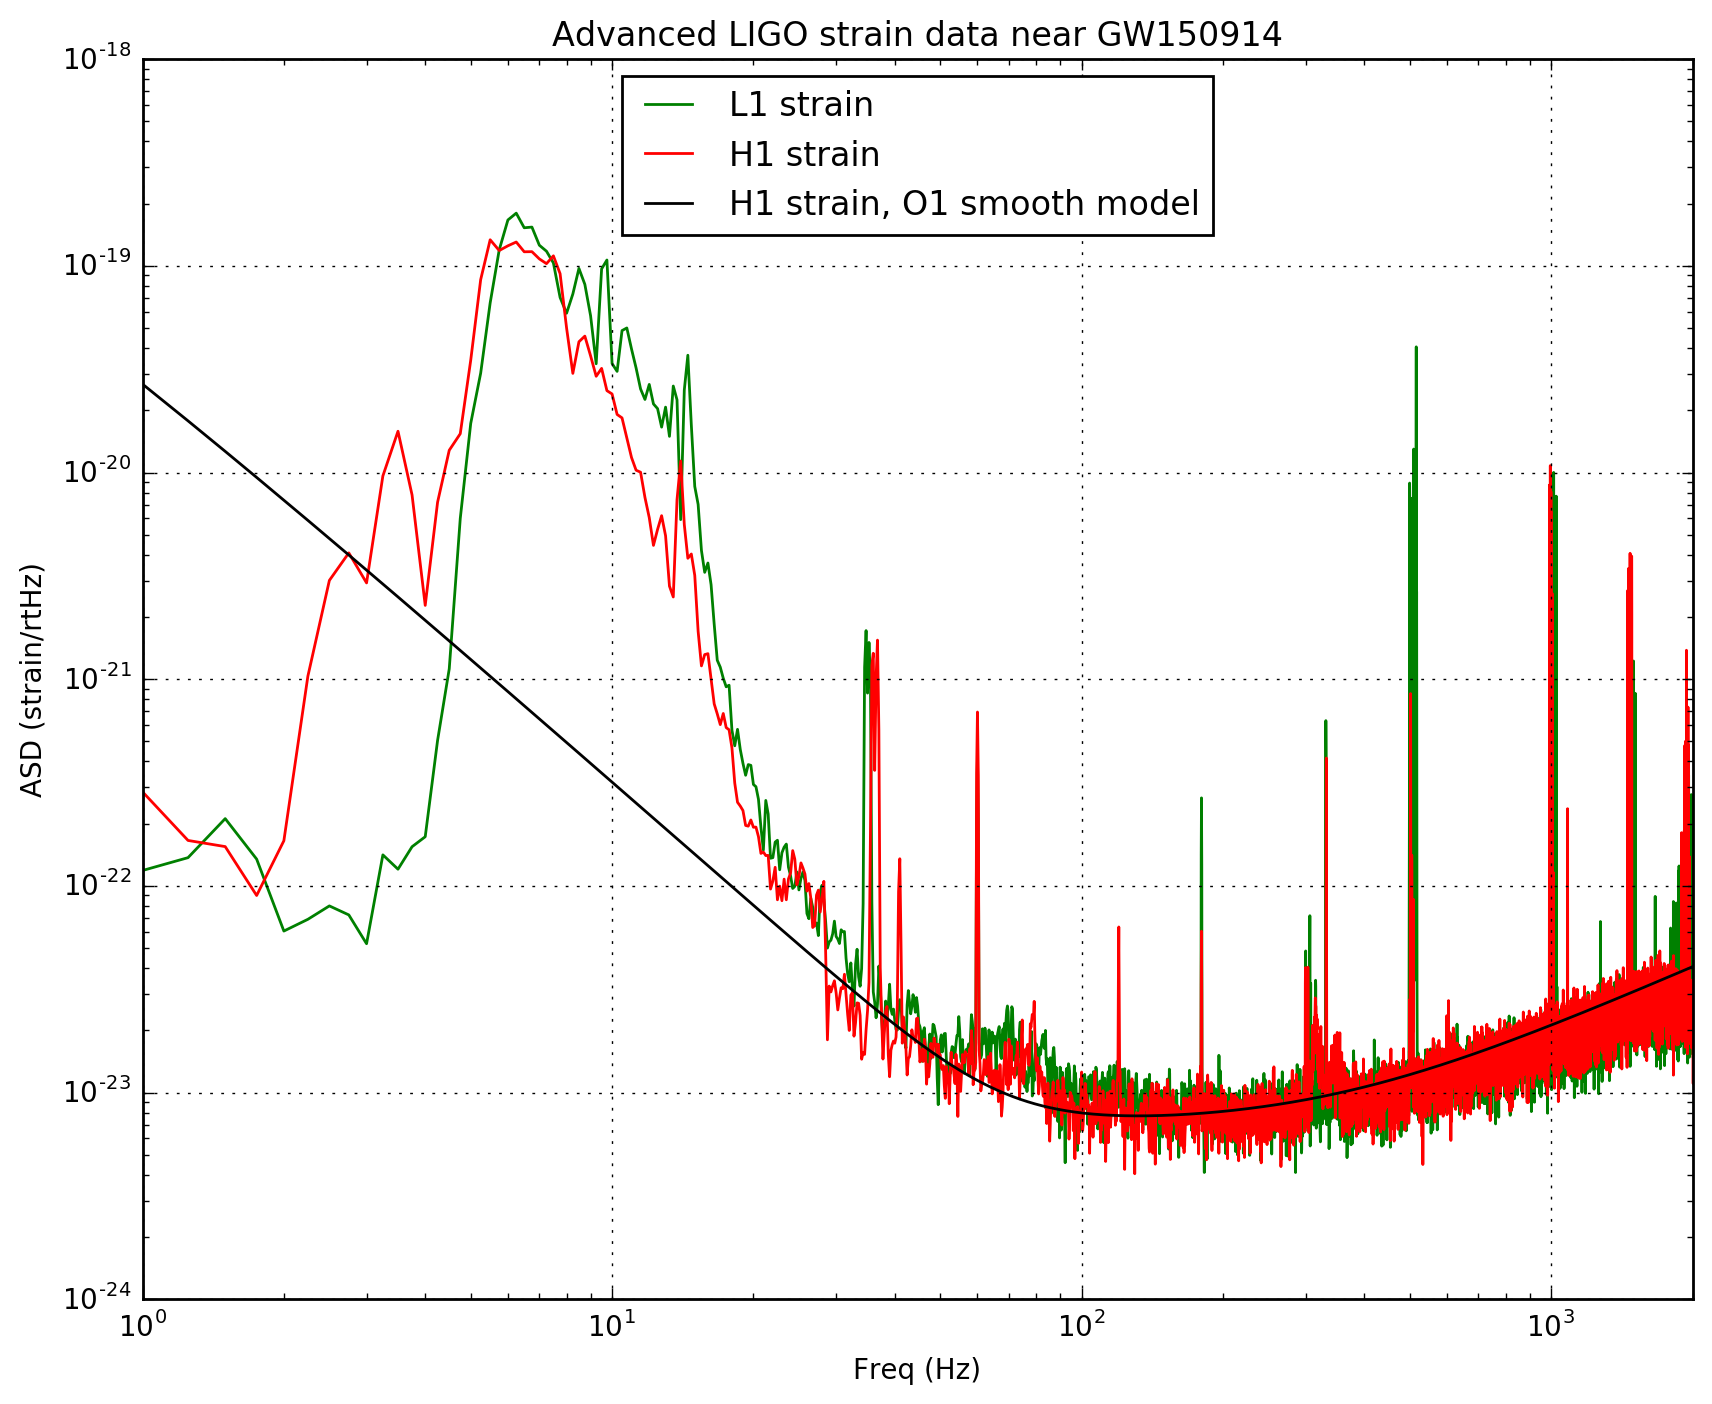
- Advanced LIGO and Virgo strain data are not calibrated below 10 Hz. For Virgo during O3 the minimum calibration frequency was 20 Hz. Advanced LIGO detector noise rises rapidly below 10 Hz; it is many orders of magnitude larger than any plausible gravitational wave strain signal. Further, the data made available on GWOSC are aggressively high-pass-filtered at 8 Hz in order to avoid downstream signal processing problems, so it doesn't properly represent either signal or noise at those low frequencies. In particular, any DC offsets have no significance. In the Initial LIGO (S5 and S6) datasets, data below 40 Hz is similarly uncalibrated and suppressed. The 8 Hz roll-off is visible in this example low frequency spectrum.
- KAGRA data are not calibrated or valid below 30 Hz or above 1500 Hz, and the data sampled at 4096 Hz are not valid above about 1500 Hz. GEO 600 data are not calibrated or valid below 40 Hz or above 6000 Hz, and the data sampled at 4096 Hz are not valid above about 1620 Hz.
- Advanced LIGO and Virgo calibrated data come with a set of files that quantify the uncertainty in the calibration, both magnitude and phase, as a function of frequency. These files, with associated documentation, are available at this link for the observing runs O1, O2 and O3, while they are available at this link for O4.
Return to the Data Page to download LIGO, Virgo, GEO and KAGRA data.