O4 Instrumental Lines
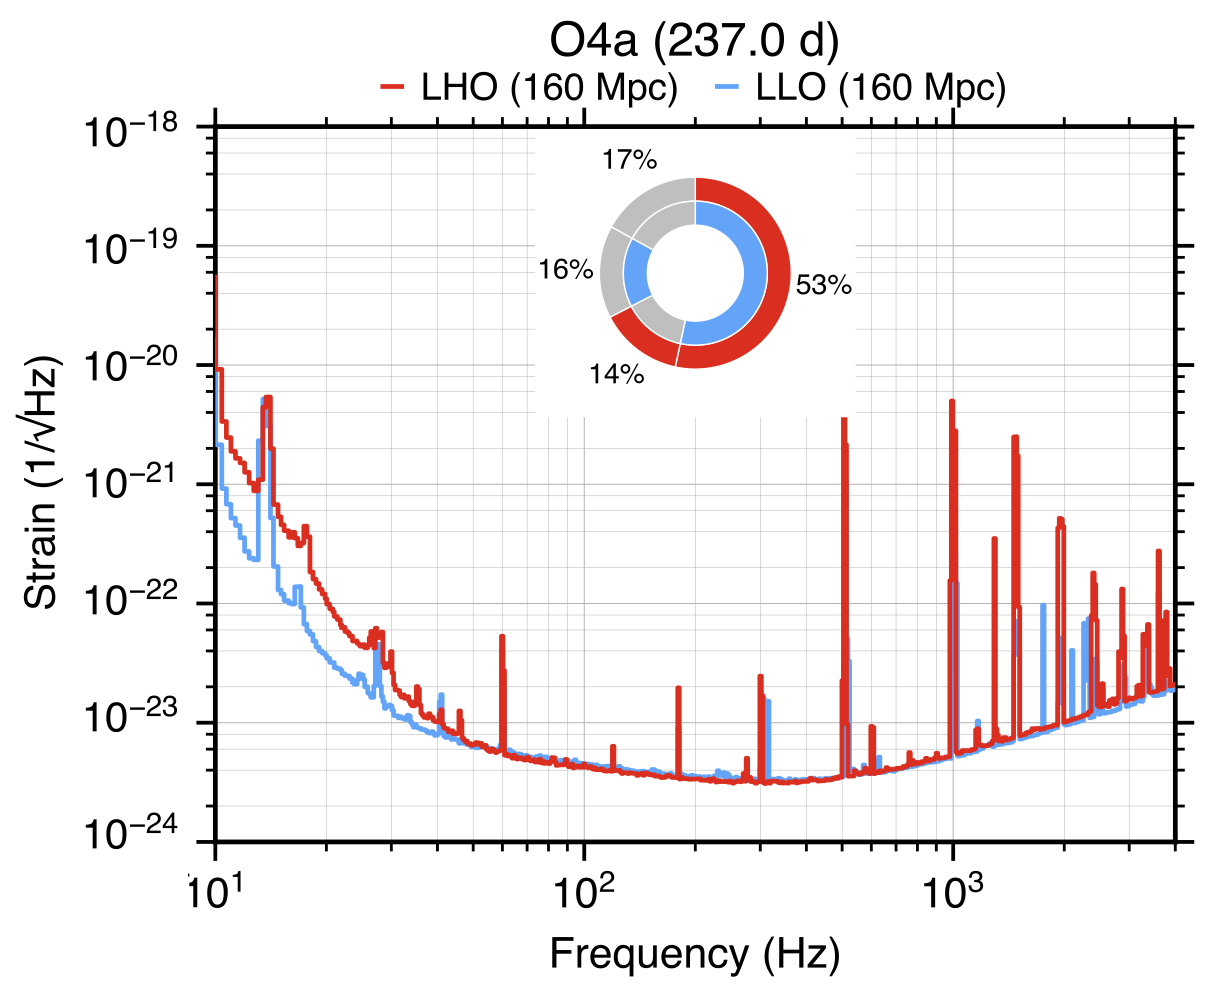
The plot below shows the amplitude spectral density (ASD) of the total strain noise in the LIGO-Hanford(red line), LIGO-Livingston(blue line) detectors. The curves are representative of the performance of each detector during O4a (from the GWTC-4.0 Catalog paper Introduction). The plot shows frequency [Hz] on the x-axis, and the ASD value [ 1 / sqrt(Hz) ] on the y-axis. The data are not calibrated below 10 Hz and above 5 kHz. Inset sunburst charts show the fraction of the run duration during which different combinations of detectors were observing. Gray regions in each ring indicates portions when a detector is not operating.
The spectra reveal a large number of narrow spectral artifacts, or "lines", due to instrumental artifacts:
When the ASD is computed over a short time interval with low spectral resolution, we observe only the strongest of the artifacts, and the ASD does not capture the full set of features found during the whole observing period. To understand, and closely mimic narrowband persistent gravitational wave searches, the ASD must be computed at higher spectral resolution and averaged over the entire observing period.
Impact on astrophysical searches
From Soni et al. (2024)
Typically, glitches impact transient GW searches and parameter estimation of candidate transient GW events but do not strongly impact searches for persistent GW. Similarly, lines impact persistent GW searches but do not strongly impact searches and parameter estimation for transient GW. Persistent broadband artifacts impact all types of searches because the artifacts elevate the noise background.
Effort is put into understanding the origin of these lines, engineering the detectors to keep the line bandwidth as narrow as possible, and mitigating the artifacts whenever possible. Line investigations are an ongoing effort as we make hardware changes to investigate, test coupling mechanisms and/or mitigate artifacts. Meanwhile, searches for persistent gravitational waves use various methods to remove known sources of contamination from the search results. They rely heavily on lists of "vetted" artifacts that are known to be non-astrophysical in origin. Many other lines are not yet included in the vetted list because their origin is unknown.
The most prominent peaks
The peaks that are most noticeable to the eye are due to known instrumental effects. For LIGO-Hanford and LIGO-Livingston we have:
- 60 Hz power line harmonics around 60*n Hz, due to upconversion of low-frequency sesimic noise. These arise due to imperfect electromagnetic shielding, and magnetic coupling to the mirror suspensions.
- Thermally excited mirror suspension "violin modes" at ~500 Hz and harmonics (~1000, ~1500, ~2000 Hz). There is a "forest" of them clustered together due to the numerous mirror suspension fibers in the LIGO interferometers and the design choices made when constructing the mirror suspension system. These are an unfortunate but inevitable part of the LIGO detector design.
- Violin modes for the suspensions that hang the beam splitter around 300 Hz and the higher harmonics 600, 900, 1200 Hz and so on. These suspension resonance artifacts are similar in nature to the other mirror suspension violin modes.
- Calibration lines purposefully added to the strain data by moving the end mirrors in order to carry out interferometer operations.
Other spectral features
In all detectors, using ASDs computed with higher resolution (1 mHz or smaller) and averaged over the full observing period, we observe a much higher number of narrowband artifacts in addition to those described above.
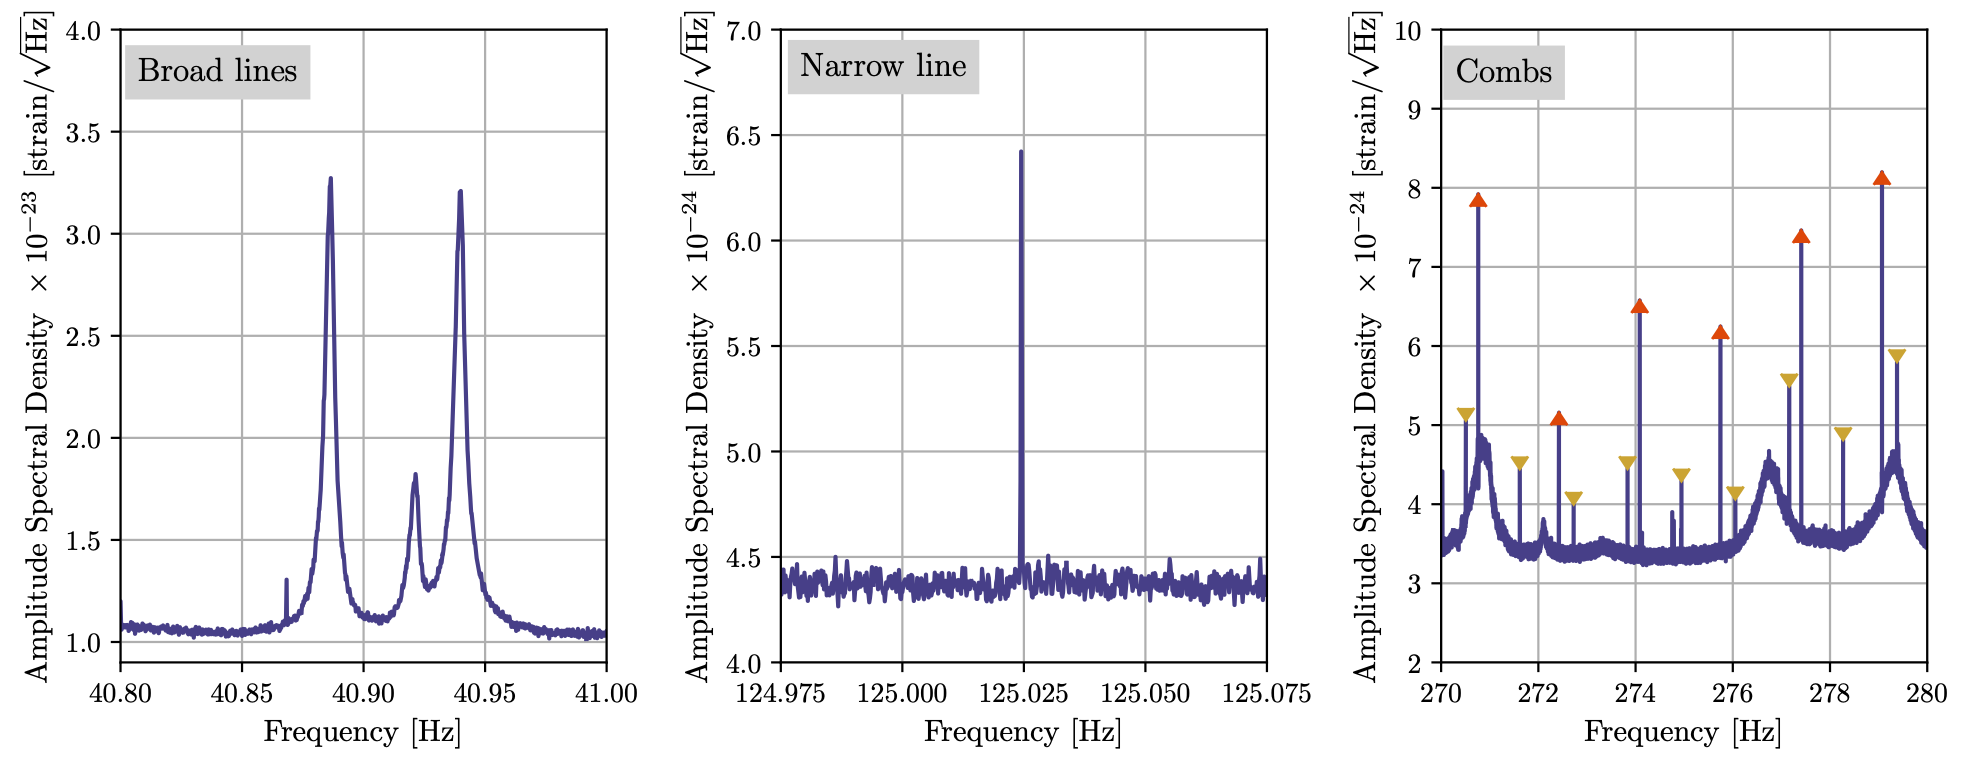
We classify lines into three categories: broad lines, narrow lines, and combs. Examples of these three classes are visible in the amplitude spectral density plot below, where the frequency resolution is Δf=138.9μHz and the data is averaged over all of O4a. The plots refer to the LIGO Hanford strain data and is taken from the O4a LIGO Detector Characterization paper (Figure 3).
References
- "LIGO Detector Characterization in the first half of the fourth Observing run" S Soni et al 2025 Class. Quantum Grav. 42 085016;
- "Identification and mitigation of narrow spectral artifacts that degrade searches for persistent gravitational waves in the first two observing runs of Advanced LIGO" Phys. Rev. D 97 (2018) 082002;
Instrumental line catalog
The following files contain lists of vetted spectral line frequencies. Each entry contains the line frequency, artifact type, estimated line width, and comments for each type of artifact. The intent is to identify spectral lines that we are confident are of instrumental (not astrophysical) origin, even if we do not understand the coupling mechanism by which they show up in the strain data; they therefore are safe to ignore or "clean" (remove in an analysis-dependent way) when searching for CW signals. A README file is included that contains information on how to use the records contained within the lines file lists.
- Text file line catalogs:
You may need to speak with a LVK expert to answer any questions about the details contained within the catalog files. You can start by checking our contact page.