S5 Instrumental Lines
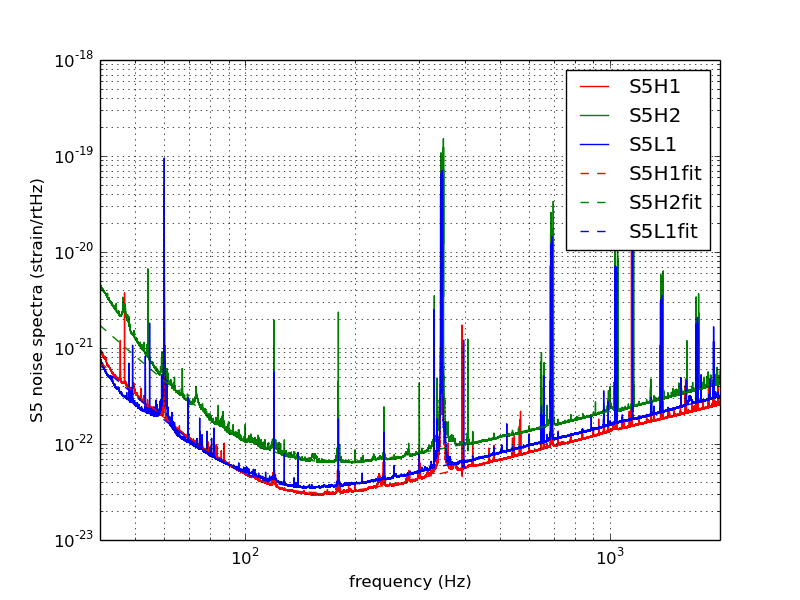
One can see many spectral lines in the noise amplitude spectral density (ASD) of the three LIGO detectors:
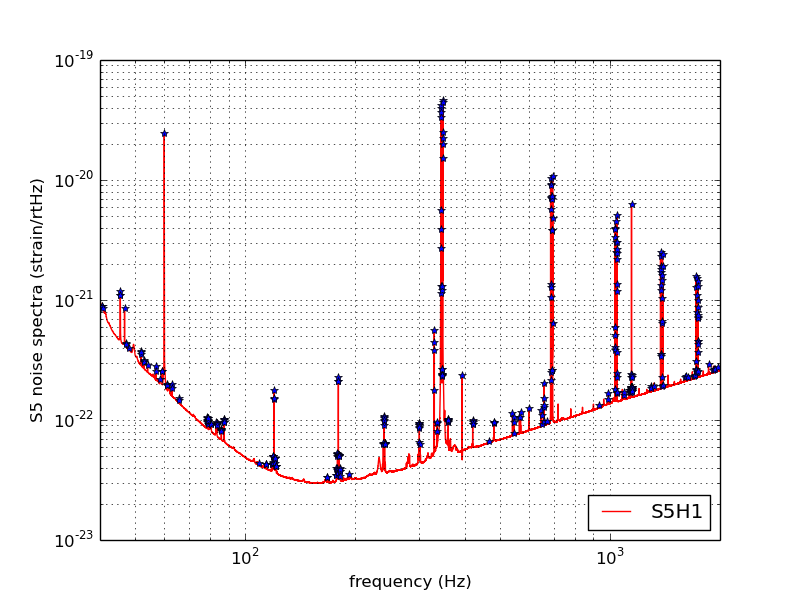
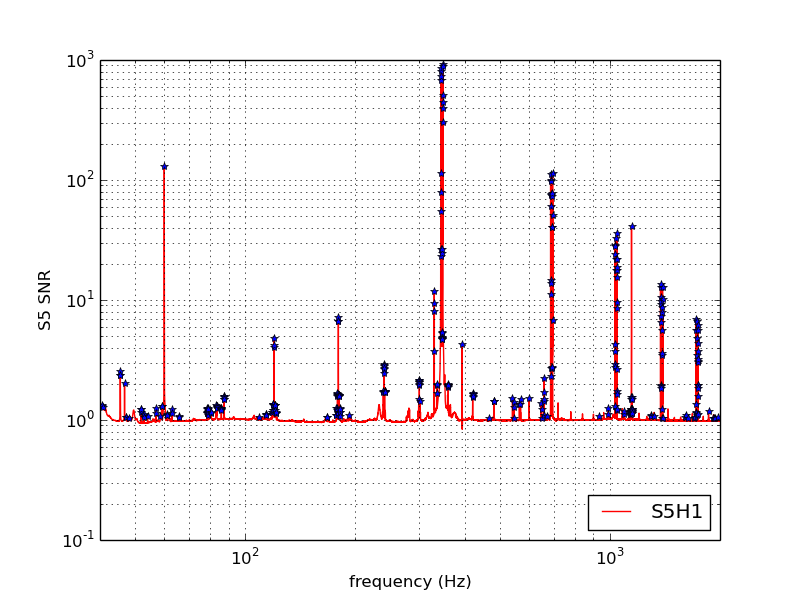
The first plot above shows hi-res ASD spectra for all three LIGO detectors, averaged over all of S5. You might be able to see a smooth curve that provides an estimate of the "noise floor" under the instrumental lines; it does a poor job of following the real noise floor below 40 Hz, especially for H2, but that's not so important here. The second plot shows the results of a very simple peak-finding algorithm run on the S5 H1 detector spectrum, and the third shows the spectrum divided by the estimated noise floor, with the peaks. (Links to plots for all three S5 detectors are below).
Impact on astrophysical searches
The excess noise from these instrumental spectral lines will obscure gravitational wave signals in that band, negatively impacting searches for signals of all morphologies (CBC, Burst, CW, stochastic). Most searches for gravitational wave signals "notch out" those bands in one way or another.
Note that continuous waves from non-spherical spinning neutron stars also appear as (extremely narrow) spectral lines. Their frequency is modulated by the Doppler shift due to the motion of our detectors with respect to the source; this is a small (part in 10^4) effect. We expect the lines to be buried in the noise, and not visible in the noise amplitude spectral densities of the detectors; matched filtering over the full observation time is required to identify potential signals in the data.
Of course, we need to be sure we understand whether these lines are instrumental in origin, or are GWs from astrophysical sources. So, effort is put into understanding the instrumental origin of these lines, and engineering the detectors to keep the line bandwidth as narrow as possible. Here is some detail on the instrumental origin of these lines.
The most prominent peaks
The peaks that are most noticeable to the eye are all due to known instrumental effects:
- 60 Hz power line harmonics, including "wings" extending +- 2 Hz around 60*n Hz, due to upconversion of low-frequency sesimic noise. These arise due to imperfect electronic shielding, and magnetic coupling to the mirror suspensions.
- Thermally excited mirror suspension "violin modes" at ~329.5 Hz and in the 335-350 Hz range, and harmonics. There is a "forest" of them due to the numerous mirror suspension wires in the LIGO interferometers. These are an unfortunate but inevitable part of the LIGO detector design.
- Calibration lines inserted by moving the end mirrors. Calibration lines during S5 :
 H1:  46.70 Hz,  393.10 Hz,  1144.30 Hz, 1605.7 Hz, 1609.7 Hz
 H2:  54.10 Hz,  407.30 Hz,  1159.70 Hz, 1622.9 Hz, 1626.7 Hz
 L1:  54.70 Hz,  396.70 Hz,  1151.50 Hz, 1613.9 Hz, 1618.9 Hz
- A few prominent lines in the 40-55 Hz band are associated with malfunctions of the optical lever lasers in the alignment control system.
- Smaller, but still visible, instrumental lines are due to the data acquisition system (multiples of 16 Hz).
- Yet smaller, but still visible, instrumental lines are due to a variety of other known effects. Some are unknown, but are still extremely unlikely to be due to GWs from astrophysical sources (eg, they are not coincident between detectors).
Instrumental line catalog
The following files contain lists of prominent spectral line frequencies, their signal strength and signal-to-noise ratio, and our identification of their instrumental origins (where known).
- Annotated xlsx spreadsheet, S5lines.xlsx
- Ascii txt files with list of peaks (frequency, peak strain, SNR): S5H1lines.txt, S5H2lines.txt, S5L1lines.txt.
- Plots of spectra showing lines: S5H1peaks.png, S5H2peaks.png, S5L1peaks.png,
- Plots of SNR showing lines: S5H1peaksnr.png, S5H2peaksnr.png, S5L1peaksnr.png,
- Code that makes the list of peaks: speclines.py.


